
- DXY comes under pressure and disputes the 103.00 support.
- Bulls now target the July high at 103.57 (July 6).
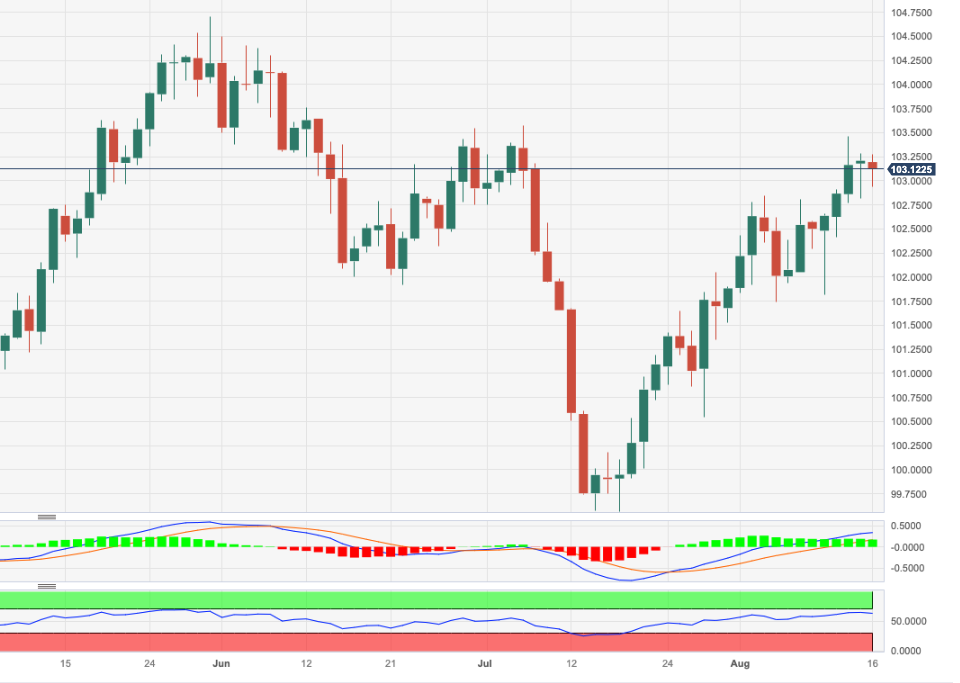
The upside momentum in the greenback appears somewhat dented and motivates DXY to give away part of the recent gains and recede to the 103.00 region on Wednesday.
In the meantime, the index maintains the bullish view well in place with the immediate hurdle now emerging at the August top of 103.45 (August 14) just ahead of the July peak of 103.57 (July 6).
It is worth noting that this area of monthly highs appears reinforced by the key 200-day SMA, today at 103.23.
Looking at the broader picture, while below the latter, the outlook for the index is expected to remain negative.
DXY daily chart
(Click on image to enlarge)
Dollar Index Spot
| OVERVIEW | |
|---|---|
| Today last price | 103.12 |
| Today Daily Change | 33 |
| Today Daily Change % | -0.09 |
| Today daily open | 103.21 |
| TRENDS | |
|---|---|
| Daily SMA20 | 101.98 |
| Daily SMA50 | 102.21 |
| Daily SMA100 | 102.33 |
| Daily SMA200 | 103.22 |
| LEVELS | |
|---|---|
| Previous Daily High | 103.28 |
| Previous Daily Low | 102.82 |
| Previous Weekly High | 102.91 |
| Previous Weekly Low | 101.82 |
| Previous Monthly High | 103.57 |
| Previous Monthly Low | 99.57 |
| Daily Fibonacci 38.2% | 103.1 |
| Daily Fibonacci 61.8% | 102.99 |
| Daily Pivot Point S1 | 102.92 |
| Daily Pivot Point S2 | 102.64 |
| Daily Pivot Point S3 | 102.46 |
| Daily Pivot Point R1 | 103.39 |
| Daily Pivot Point R2 | 103.56 |
| Daily Pivot Point R3 | 103.85 |
More By This Author:
Crude Oil Futures: Downside Could Be Losing MomentumEUR/JPY Price Analysis: Next Target Now Emerges At 160.00
USD Index Faces Extra Selling Pressure Near 102.20 Ahead Of CPI


Comments
Log in or sign up to join the conversation.