USD Index Price Analysis: Immediately To The Upside Comes 104.70

Image Source: Pexels
- The index manages well to keep the trade above the 104.00 mark.
- Extra gains are likely and could retest the 2023 top around 105.60.
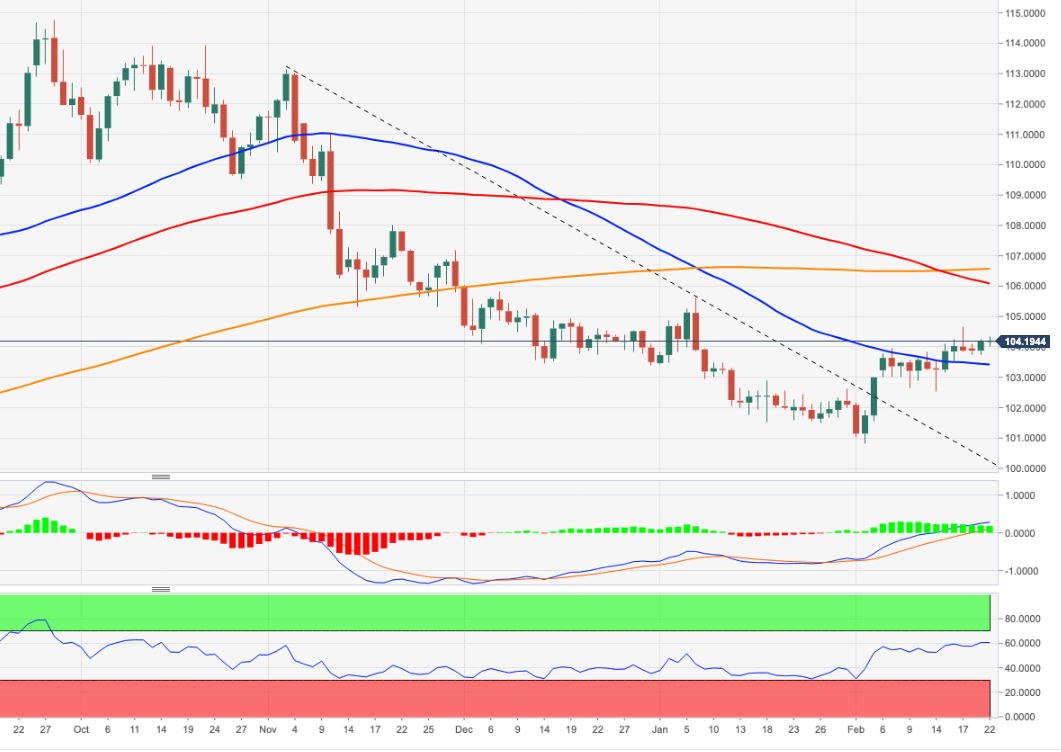
DXY tries to extend the weekly recovery further north of the 104.00 barrier on Wednesday.
The ongoing price action favours the continuation of the uptrend for the time being. Further bouts of strength should clear the February high at 104.66 (February 17) to allow for a probable challenge of the 2023 top at 105.63 (January 6).
In the longer run, while below the 200-day SMA at 106.44, the outlook for the index remains negative.
DXY daily chart
Dollar Index Spot
| OVERVIEW | |
|---|---|
| Today last price | 104.17 |
| Today Daily Change | 34 |
| Today Daily Change % | -0.02 |
| Today daily open | 104.19 |
| TRENDS | |
|---|---|
| Daily SMA20 | 102.96 |
| Daily SMA50 | 103.31 |
| Daily SMA100 | 105.45 |
| Daily SMA200 | 106.79 |
| LEVELS | |
|---|---|
| Previous Daily High | 104.27 |
| Previous Daily Low | 103.76 |
| Previous Weekly High | 104.68 |
| Previous Weekly Low | 102.54 |
| Previous Monthly High | 105.63 |
| Previous Monthly Low | 101.5 |
| Daily Fibonacci 38.2% | 104.07 |
| Daily Fibonacci 61.8% | 103.95 |
| Daily Pivot Point S1 | 103.88 |
| Daily Pivot Point S2 | 103.57 |
| Daily Pivot Point S3 | 103.38 |
| Daily Pivot Point R1 | 104.39 |
| Daily Pivot Point R2 | 104.58 |
| Daily Pivot Point R3 | 104.89 |
More By This Author:
EUR/USD Meets Some Resistance Just Above 1.0700USD Index Price Analysis: Door Open To A Visit To The 105.60 Region
EUR/USD Sinks To 6-Week Lows Near 1.0630, Dollar Remains Strong
Disclosure: Information on this article contains forward-looking statements that involve risks and uncertainties. Markets and instruments profiled on this page are for informational purposes ...
moreComments
Please wait...
Comment posted successfully
No Thumbs up yet!


