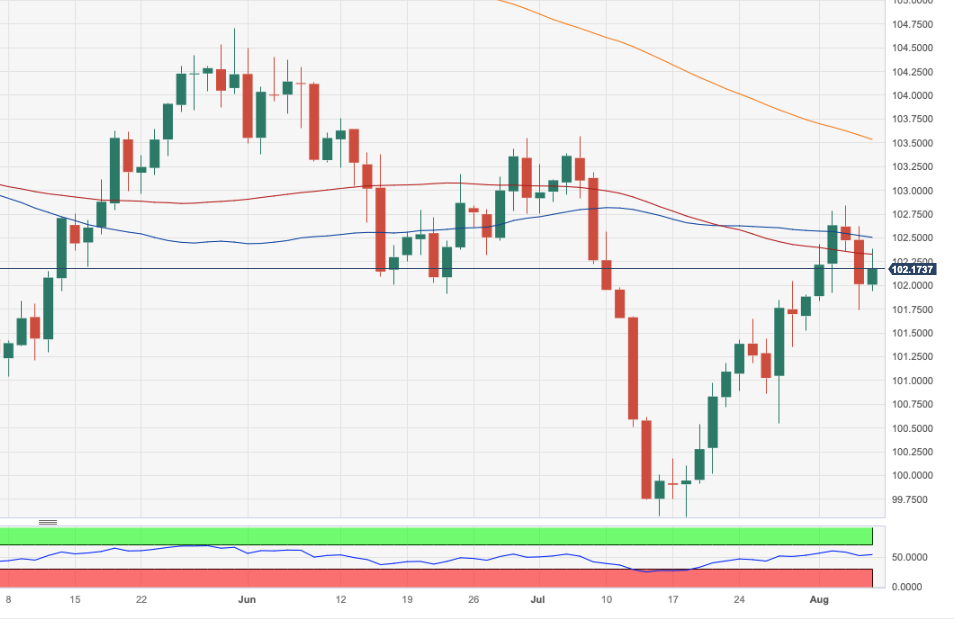
USD Index Price Analysis: Immediate Hurdle Comes At 102.84

Image Source: Pexels
- DXY regains upside traction following two daily pullbacks in a row.
- There is an initial hurdle at the monthly high of 102.84.
DXY regains composure and reclaims the area beyond the key 102.00 hurdle at the beginning of the week.
The index manages to leave behind part of the selling pressure seen in the latter part of the week and retakes the 102.00 yardstick and beyond on Monday. The index needs to rapidly clear the so far monthly top of 102.84 (August 3) to allow for a potential move to the July top of 103.57 (July 3), which appears underpinned by the proximity of the key 200-day SMA.
Looking at the broader picture, while below the 200-day SMA (103.52) the outlook for the index is expected to remain negative.
DXY daily chart
(Click on image to enlarge)
Dollar Index Spot
| OVERVIEW | |
|---|---|
| Today last price | 102.19 |
| Today Daily Change | 42 |
| Today Daily Change % | 0.18 |
| Today daily open | 102.01 |
| TRENDS | |
|---|---|
| Daily SMA20 | 101.22 |
| Daily SMA50 | 102.39 |
| Daily SMA100 | 102.34 |
| Daily SMA200 | 103.36 |
| LEVELS | |
|---|---|
| Previous Daily High | 102.62 |
| Previous Daily Low | 101.74 |
| Previous Weekly High | 102.84 |
| Previous Weekly Low | 101.53 |
| Previous Monthly High | 103.57 |
| Previous Monthly Low | 99.57 |
| Daily Fibonacci 38.2% | 102.08 |
| Daily Fibonacci 61.8% | 102.28 |
| Daily Pivot Point S1 | 101.63 |
| Daily Pivot Point S2 | 101.25 |
| Daily Pivot Point S3 | 100.76 |
| Daily Pivot Point R1 | 102.51 |
| Daily Pivot Point R2 | 103 |
| Daily Pivot Point R3 | 103.38 |
More By This Author:
USD Index Resumes The Uptrend And Regains 102.30EUR/USD Price Analysis: The Hunt For The 1.1150 Zone
Natural Gas Futures: Room For Further Advance
Disclosure: Information on this article contains forward-looking statements that involve risks and uncertainties. Markets and instruments profiled on this page are for informational purposes ...
more


