USD Index Price Analysis: Further Weakness In Store Near Term

Image Source: Pexels
- DXY adds to the weekly leg lower and approaches 102.40.
- Next on the downside emerges the 102.00 zone.
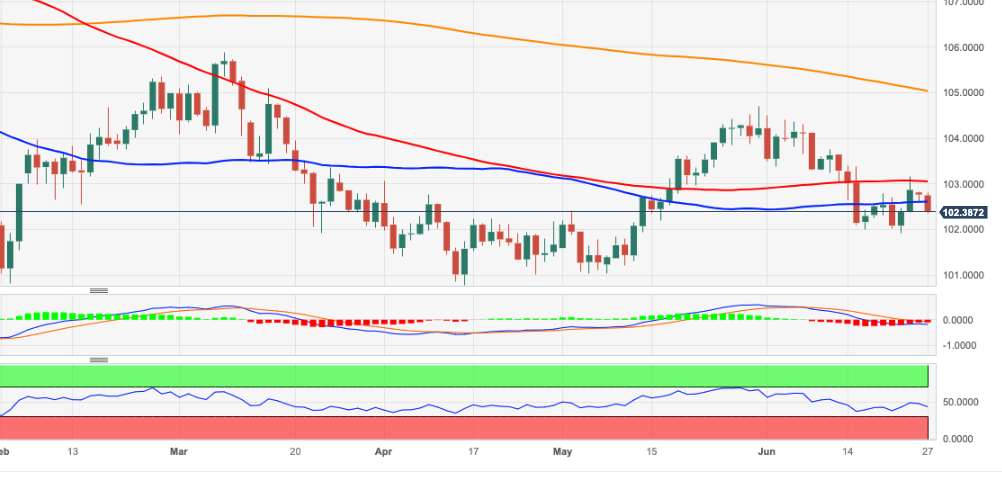
DXY keeps the weekly bearish note unchanged and retreats to the 102.40/35 band on Tuesday.
The index came under renewed downside pressure following last week’s tops past the 103.00 hurdle. Against that, there is still room for the index to revisit June lows in the 102.00 region, while a sustainable breach of this level could expose a deeper decline to April/May lows near 101.00. Dow from here emerges the 2023 low around 100.80 recorded on April 14.
Looking at the broader picture, while below the 200-day SMA at 105.03 the outlook for the index is expected to remain negative.
DXY daily chart
(Click on image to enlarge)
Dollar Index Spot
| OVERVIEW | |
|---|---|
| Today last price | 102.41 |
| Today Daily Change | 44 |
| Today Daily Change % | -0.35 |
| Today daily open | 102.77 |
| TRENDS | |
|---|---|
| Daily SMA20 | 103.23 |
| Daily SMA50 | 102.7 |
| Daily SMA100 | 103.07 |
| Daily SMA200 | 104.76 |
| LEVELS | |
|---|---|
| Previous Daily High | 102.84 |
| Previous Daily Low | 102.61 |
| Previous Weekly High | 103.17 |
| Previous Weekly Low | 101.92 |
| Previous Monthly High | 104.7 |
| Previous Monthly Low | 101.03 |
| Daily Fibonacci 38.2% | 102.7 |
| Daily Fibonacci 61.8% | 102.75 |
| Daily Pivot Point S1 | 102.64 |
| Daily Pivot Point S2 | 102.51 |
| Daily Pivot Point S3 | 102.42 |
| Daily Pivot Point R1 | 102.87 |
| Daily Pivot Point R2 | 102.97 |
| Daily Pivot Point R3 | 103.09 |
More By This Author:
Crude Oil Futures: Further Gains Not Ruled Out Near TermEUR/USD Price Analysis: Minor Support Emerges Near 1.0840
EUR/JPY Price Analysis: Technical Correction Has Further Legs To Go
Disclosure: Information on this article contains forward-looking statements that involve risks and uncertainties. Markets and instruments profiled on this page are for informational purposes ...
more


