

Image Source: Unsplash
- DXY recedes to the lower end of the weekly range near 104.60.
- Next on the upside emerges the 2023 peak around 105.60.
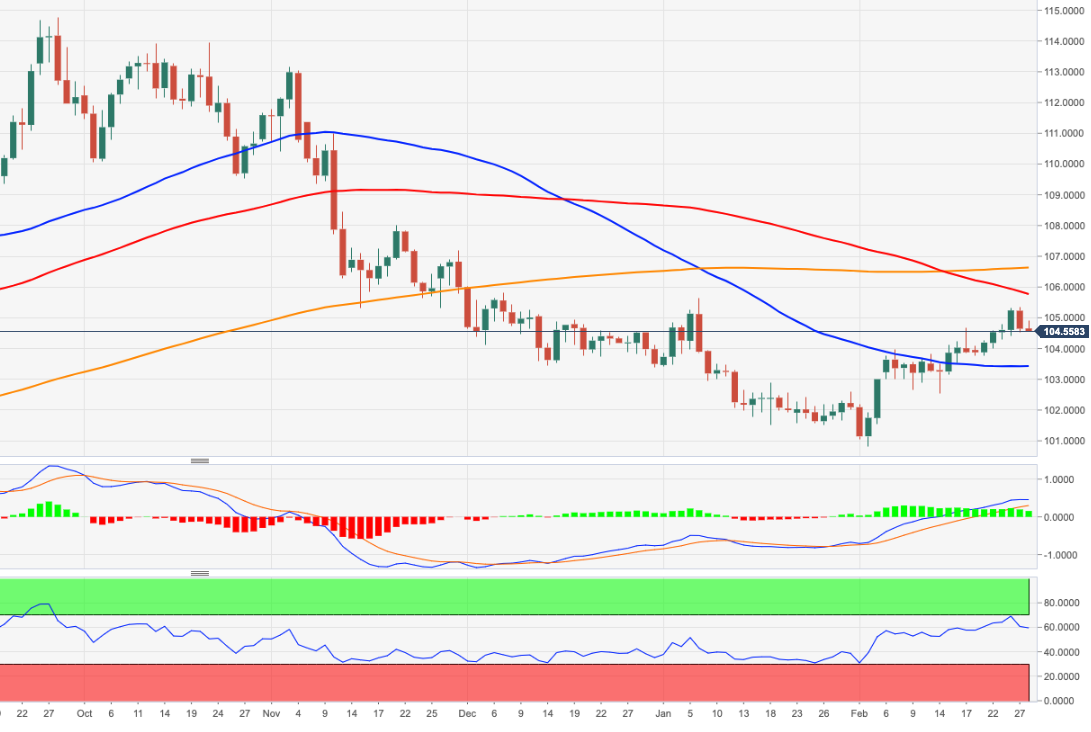
DXY alternates gains with losses near 104.60 following Monday’s market retracement.
The ongoing price action favors the continuation of the uptrend despite the ongoing corrective move. Further bouts of strength should then clear the February high at 105.35 (February 27) to allow for a probable challenge of the 2023 top at 105.63 (January 6).
In the longer run, while below the 200-day SMA at 106.49, the outlook for the index remains negative.
DXY daily chart
Dollar Index Spot
| OVERVIEW | |
|---|---|
| Today last price | 104.63 |
| Today Daily Change | 34 |
| Today Daily Change % | -0.02 |
| Today daily open | 104.65 |
| TRENDS | |
|---|---|
| Daily SMA20 | 103.53 |
| Daily SMA50 | 103.33 |
| Daily SMA100 | 105.19 |
| Daily SMA200 | 106.83 |
| LEVELS | |
|---|---|
| Previous Daily High | 105.36 |
| Previous Daily Low | 104.54 |
| Previous Weekly High | 105.32 |
| Previous Weekly Low | 103.76 |
| Previous Monthly High | 105.63 |
| Previous Monthly Low | 101.5 |
| Daily Fibonacci 38.2% | 104.85 |
| Daily Fibonacci 61.8% | 105.05 |
| Daily Pivot Point S1 | 104.34 |
| Daily Pivot Point S2 | 104.03 |
| Daily Pivot Point S3 | 103.52 |
| Daily Pivot Point R1 | 105.16 |
| Daily Pivot Point R2 | 105.67 |
| Daily Pivot Point R3 | 105.98 |
More By This Author:
EUR/JPY Price Analysis: Further Gains Likely On A Close Above 144.16Natural Gas Futures: Further Upside Momentum Could Lose Traction
EUR/JPY Price Analysis: Interim Top Above 144.00?


Comments
Log in or sign up to join the conversation.