EUR/JPY Price Analysis: Further Gains Likely On A Close Above 144.16

Image Source: Pixabay
- EUR/JPY navigates within a narrow range below the 144.00 mark.
- A move above the 2023 peak should spark extra upside.
EUR/JPY alternates gains with losses in the sub-144.00 region at the beginning of the week.
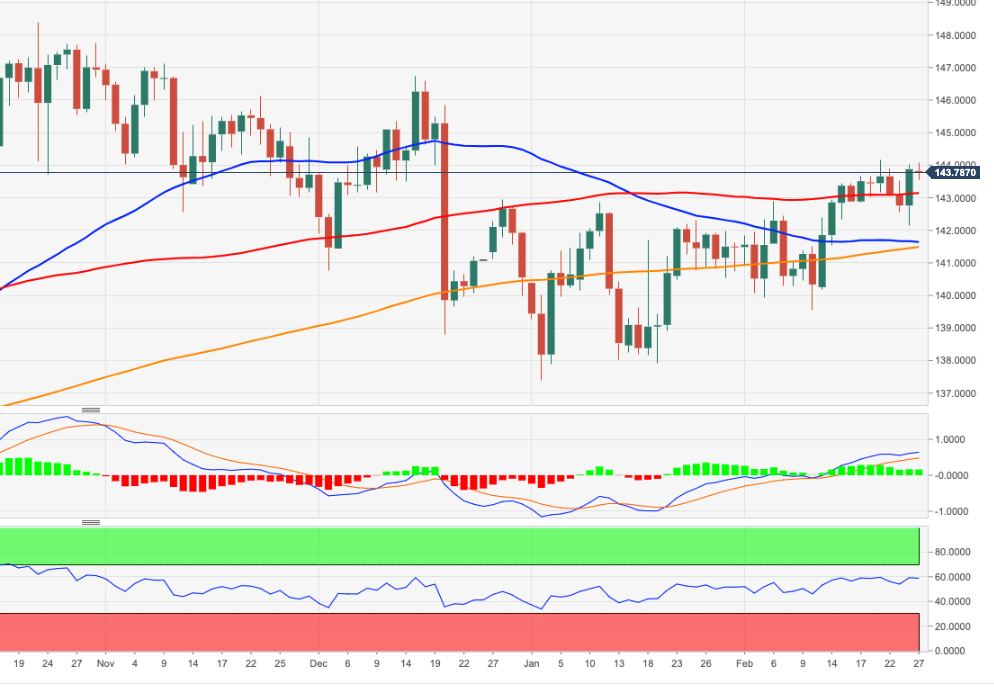
While the cross looks somewhat side-lined for the time being, a convincing breakout of the 2023 high at 144.16 (February 21) could spark extra strength to, initially, the December 2022 peak at 146.72 (December 15).
In the meantime, while above the 200-day SMA, today at 141.45, the outlook for the cross is expected to remain positive.
EUR/JPY daily chart
(Click on image to enlarge)
EUR/JPY
| OVERVIEW | |
|---|---|
| Today last price | 143.8 |
| Today Daily Change | 51 |
| Today Daily Change % | -0.06 |
| Today daily open | 143.88 |
| TRENDS | |
|---|---|
| Daily SMA20 | 142.16 |
| Daily SMA50 | 141.34 |
| Daily SMA100 | 143.12 |
| Daily SMA200 | 141.46 |
| LEVELS | |
|---|---|
| Previous Daily High | 144.01 |
| Previous Daily Low | 142.16 |
| Previous Weekly High | 144.16 |
| Previous Weekly Low | 142.16 |
| Previous Monthly High | 142.86 |
| Previous Monthly Low | 137.39 |
| Daily Fibonacci 38.2% | 143.3 |
| Daily Fibonacci 61.8% | 142.86 |
| Daily Pivot Point S1 | 142.69 |
| Daily Pivot Point S2 | 141.49 |
| Daily Pivot Point S3 | 140.83 |
| Daily Pivot Point R1 | 144.54 |
| Daily Pivot Point R2 | 145.2 |
| Daily Pivot Point R3 | 146.4 |
More By This Author:
Natural Gas Futures: Further Upside Momentum Could Lose TractionEUR/JPY Price Analysis: Interim Top Above 144.00?
USD Index Price Analysis: Immediately To The Upside Comes 104.70
Disclosure: Information on this article contains forward-looking statements that involve risks and uncertainties. Markets and instruments profiled on this page are for informational purposes ...
moreComments
Please wait...
Comment posted successfully
No Thumbs up yet!


