
- DXY builds on Tuesday’s gains and reaches the 104.00 region.
- Next on the upside comes the May high near 104.70.
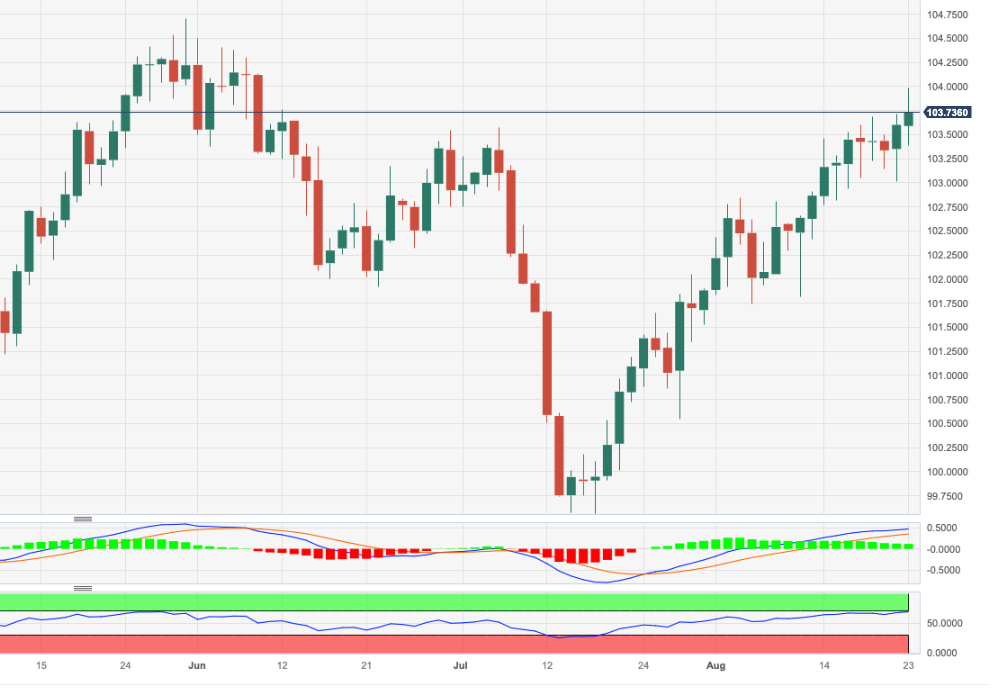
DXY advances further and hits fresh multi-week peaks around the 104.00 neighborhood on Wednesday.
A convincing breakout of the 104.00 hurdle should open the door to a potential visit to the May top of 104.69 (May 31) ahead of the 2023 peak of 105.88 (March 8).
While above the key 200-day SMA, today at 103.15, the outlook for the index is expected to shift to a more constructive one.
Looking at the broader picture, a convincing breakout of the 200-day SMA should shift the outlook for the index to a more constructive one.
DXY daily chart
(Click on image to enlarge)
Dollar Index Spot
| OVERVIEW | |
|---|---|
| Today last price | 103.75 |
| Today Daily Change | 60 |
| Today Daily Change % | 0.14 |
| Today daily open | 103.6 |
| TRENDS | |
|---|---|
| Daily SMA20 | 102.6 |
| Daily SMA50 | 102.2 |
| Daily SMA100 | 102.39 |
| Daily SMA200 | 103.13 |
| LEVELS | |
|---|---|
| Previous Daily High | 103.72 |
| Previous Daily Low | 103.01 |
| Previous Weekly High | 103.68 |
| Previous Weekly Low | 102.77 |
| Previous Monthly High | 103.57 |
| Previous Monthly Low | 99.57 |
| Daily Fibonacci 38.2% | 103.45 |
| Daily Fibonacci 61.8% | 103.28 |
| Daily Pivot Point S1 | 103.17 |
| Daily Pivot Point S2 | 102.74 |
| Daily Pivot Point S3 | 102.47 |
| Daily Pivot Point R1 | 103.87 |
| Daily Pivot Point R2 | 104.15 |
| Daily Pivot Point R3 | 104.58 |
More By This Author:
EUR/JPY Price Analysis: Interim Support Comes Near 156.00Crude Oil Futures: Extra Downside Is Not Ruled Out
USD Index Price Analysis: Immediately To The Upside Comes 103.70


Comments
Log in or sign up to join the conversation.