
- DXY accelerates its losses and approaches 103.00.
- Immediately to the downside comes the weekly low of 102.93.
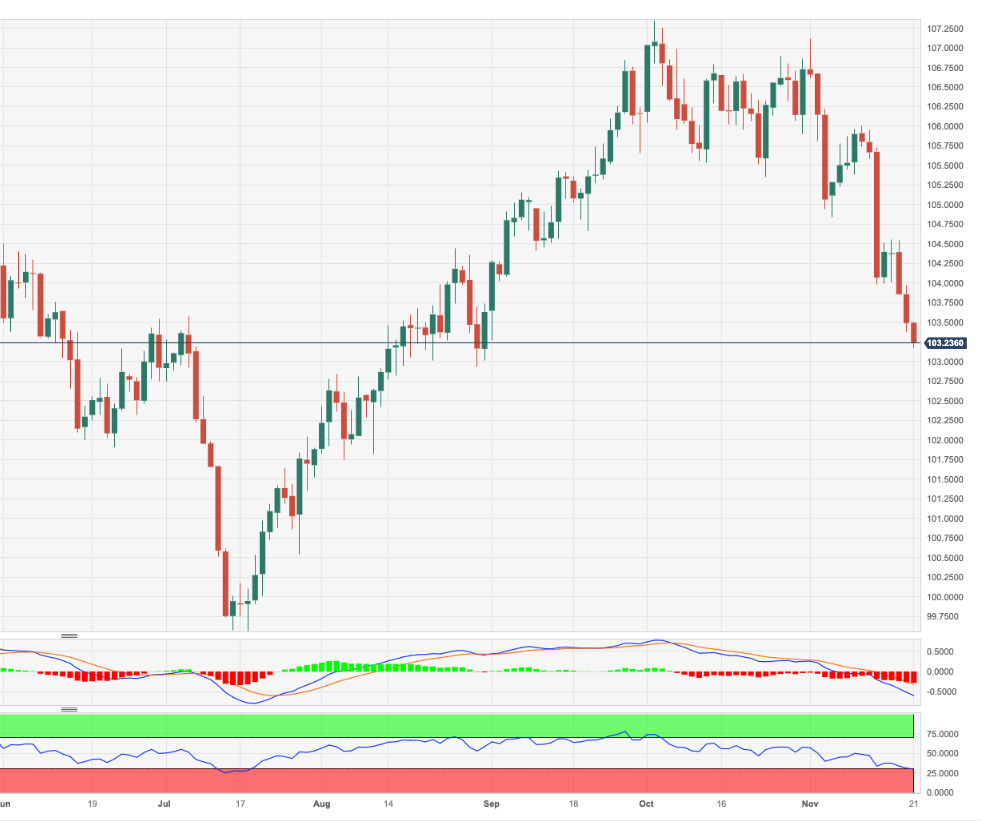
DXY retreats for the third session in a row and trades at shouting distance from the key 103.00 support, or three-month lows.
In case bears push harder, the breakdown of the November low of 103.17 should leave the door open to further retracements in the short-term horizon. That said, the next support emerges at the weekly low of 102.93 (August 30) prior to the psychological 100.00 threshold.
In the meantime, while below the key 200-day SMA at 103.61, the outlook for the index is expected to remain bearish.
DXY daily chart
(Click on image to enlarge)
Dollar Index Spot
| OVERVIEW | |
|---|---|
| Today last price | 103.31 |
| Today Daily Change | 29 |
| Today Daily Change % | -0.17 |
| Today daily open | 103.49 |
| TRENDS | |
|---|---|
| Daily SMA20 | 105.53 |
| Daily SMA50 | 105.79 |
| Daily SMA100 | 104.2 |
| Daily SMA200 | 103.62 |
| LEVELS | |
|---|---|
| Previous Daily High | 103.97 |
| Previous Daily Low | 103.38 |
| Previous Weekly High | 105.96 |
| Previous Weekly Low | 103.85 |
| Previous Monthly High | 107.35 |
| Previous Monthly Low | 105.35 |
| Daily Fibonacci 38.2% | 103.61 |
| Daily Fibonacci 61.8% | 103.75 |
| Daily Pivot Point S1 | 103.26 |
| Daily Pivot Point S2 | 103.02 |
| Daily Pivot Point S3 | 102.66 |
| Daily Pivot Point R1 | 103.85 |
| Daily Pivot Point R2 | 104.21 |
| Daily Pivot Point R3 | 104.44 |
More By This Author:
Natural Gas Futures: A Deeper Drop Seems UnlikelyCrude Oil Futures: Further Recovery Not Favoured
Gold Futures: Rebound Could Extend Further


Comments
Log in or sign up to join the conversation.