

- DXY maintains the weekly bounce well in place on Wednesday.
- Further advance is expected to challenge the 103.00 zone.
DXY advances for the fourth session in a row and retests weekly highs around 102.70 on Wednesday.
Immediately to the upside, the index faces the next hurdle at the 103.00 round level, which appears reinforced by the proximity of the temporary 100-day SMA. The index could see its downside pressure mitigated once this area is cleared on a convincing fashion.
Looking at the broader picture, while below the 200-day SMA at 105.18 the outlook for the index is expected to remain negative.
DXY daily chart
(Click on image to enlarge)
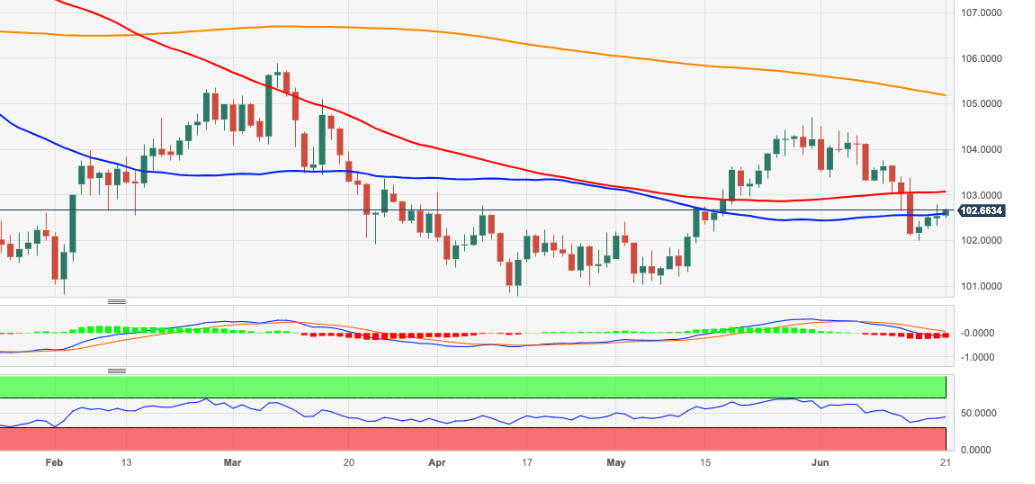
Dollar Index Spot
| OVERVIEW | |
|---|---|
| Today last price | 102.68 |
| Today Daily Change | 21 |
| Today Daily Change % | 0.14 |
| Today daily open | 102.54 |
| TRENDS | |
|---|---|
| Daily SMA20 | 103.55 |
| Daily SMA50 | 102.62 |
| Daily SMA100 | 103.06 |
| Daily SMA200 | 104.94 |
| LEVELS | |
|---|---|
| Previous Daily High | 102.79 |
| Previous Daily Low | 102.32 |
| Previous Weekly High | 103.76 |
| Previous Weekly Low | 102.01 |
| Previous Monthly High | 104.7 |
| Previous Monthly Low | 101.03 |
| Daily Fibonacci 38.2% | 102.61 |
| Daily Fibonacci 61.8% | 102.5 |
| Daily Pivot Point S1 | 102.31 |
| Daily Pivot Point S2 | 102.08 |
| Daily Pivot Point S3 | 101.84 |
| Daily Pivot Point R1 | 102.78 |
| Daily Pivot Point R2 | 103.02 |
| Daily Pivot Point R3 | 103.25 |
More By This Author:
Crude Oil Futures: Extra Decline In The Pipeline
USD Index Price Analysis: Risks Further Weakness Near Term
Natural Gas Futures: Strong Rebound Could Struggle To Continue



Comments
Log in or sign up to join the conversation.