
- DXY manages to regain some composure following Tuesday’s sell-off.
- Losses are expected to accelerate below the monthly low of 103.98.
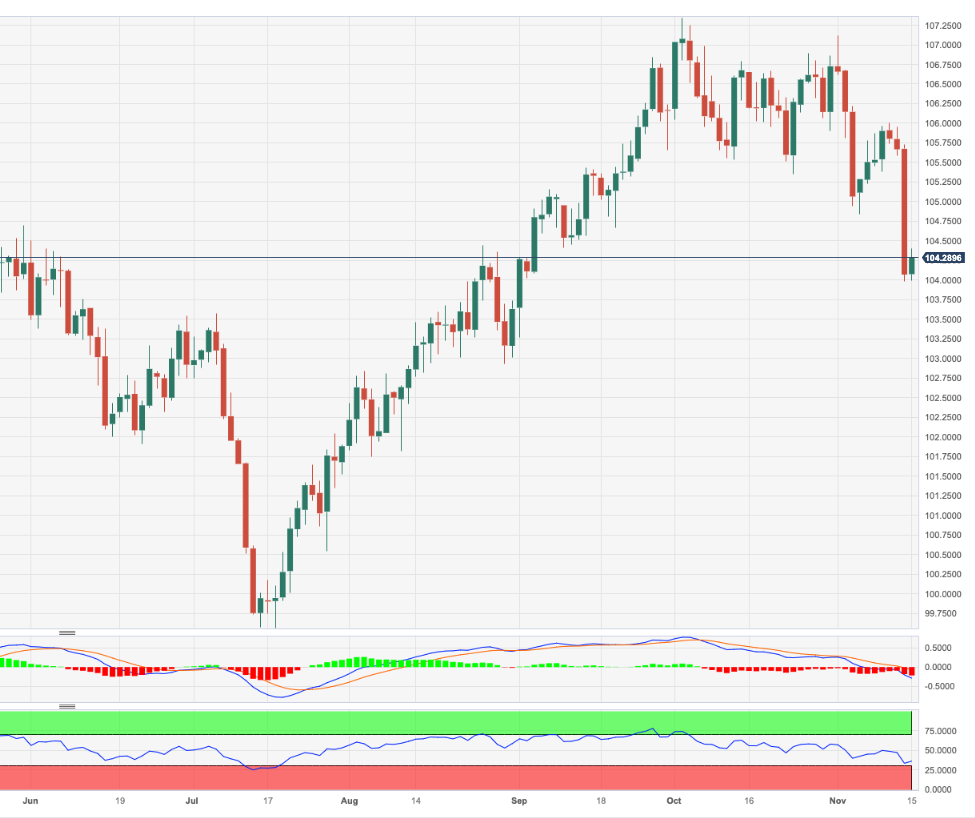
DXY attempts a mild recovery to the 104.30/40 band after bottoming out just below the 104.00 support earlier in the session on Wednesday.
The breakdown of the November low of 103.98 (November 14-15) should pave the way for a quick test of the critical 200-day SMA at 103.60 prior to the weekly low of 102.96 (August 30).
In the meantime, while above the key 200-day SMA, today at 103.60, the outlook for the index is expected to remain constructive.
DXY daily chart
(Click on image to enlarge)
Dollar Index Spot
| OVERVIEW | |
|---|---|
| Today last price | 104.34 |
| Today Daily Change | 41 |
| Today Daily Change % | 0.26 |
| Today daily open | 104.07 |
| TRENDS | |
|---|---|
| Daily SMA20 | 105.95 |
| Daily SMA50 | 105.86 |
| Daily SMA100 | 104.16 |
| Daily SMA200 | 103.61 |
| LEVELS | |
|---|---|
| Previous Daily High | 105.73 |
| Previous Daily Low | 103.99 |
| Previous Weekly High | 106.01 |
| Previous Weekly Low | 104.85 |
| Previous Monthly High | 107.35 |
| Previous Monthly Low | 105.35 |
| Daily Fibonacci 38.2% | 104.65 |
| Daily Fibonacci 61.8% | 105.07 |
| Daily Pivot Point S1 | 103.46 |
| Daily Pivot Point S2 | 102.85 |
| Daily Pivot Point S3 | 101.72 |
| Daily Pivot Point R1 | 105.21 |
| Daily Pivot Point R2 | 106.34 |
| Daily Pivot Point R3 | 106.95 |
More By This Author:
Crude Oil Futures: Some Consolidation Emerges On The CardsEUR/USD Price Analysis: Outlook Shifts To Constructive Above 1.0800
EUR/JPY Price Analysis: Upside Momentum Has Further Legs To Go


Comments
Log in or sign up to join the conversation.