USD Index Price Analysis: Extra Gains Target The May High Near 104.80
- DXY adds to Friday’s gains well north of the 104.00 barrier.
- Further upside is seen revisiting the May top around 104.80.
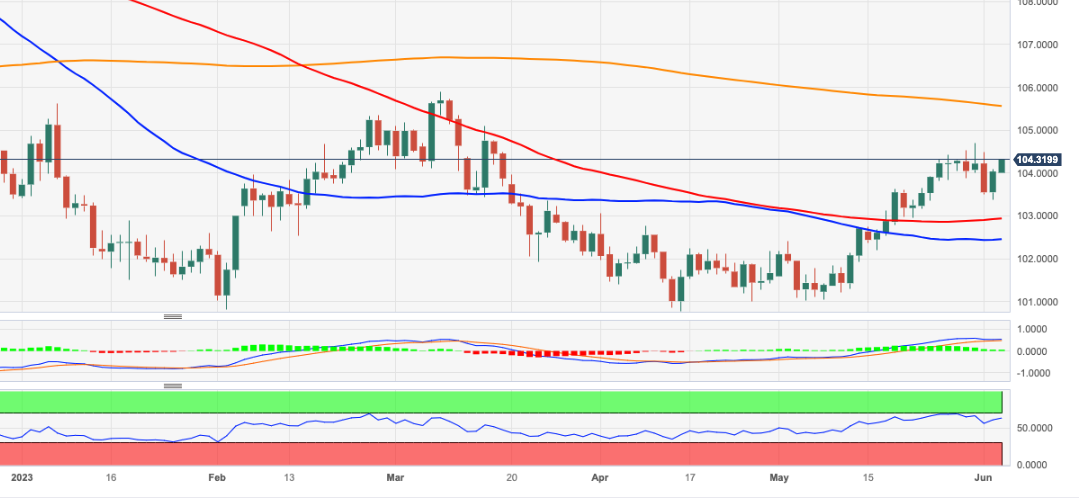
DXY’s rebound picks up pace and tests 2-day highs past the 104.00 hurdle on Monday.
Considering the current price action, further advances could initially see the May top of 104.79 (May 31) revisited in the relatively near term. From here, the index could target the minor hurdle at the round level of 105.00 ahead of the crucial 200-day SMA, today at 105.56.
Looking at the broader picture, while below the 200-day SMA, the outlook for the index is expected to remain negative.
DXY daily chart
(Click on image to enlarge)
Dollar Index Spot
| OVERVIEW | |
|---|---|
| Today last price | 104.32 |
| Today Daily Change | 29 |
| Today Daily Change % | 0.27 |
| Today daily open | 104.04 |
| TRENDS | |
|---|---|
| Daily SMA20 | 103.16 |
| Daily SMA50 | 102.39 |
| Daily SMA100 | 102.92 |
| Daily SMA200 | 105.45 |
| LEVELS | |
|---|---|
| Previous Daily High | 104.09 |
| Previous Daily Low | 103.38 |
| Previous Weekly High | 104.7 |
| Previous Weekly Low | 103.38 |
| Previous Monthly High | 104.7 |
| Previous Monthly Low | 101.03 |
| Daily Fibonacci 38.2% | 103.82 |
| Daily Fibonacci 61.8% | 103.65 |
| Daily Pivot Point S1 | 103.58 |
| Daily Pivot Point S2 | 103.13 |
| Daily Pivot Point S3 | 102.87 |
| Daily Pivot Point R1 | 104.29 |
| Daily Pivot Point R2 | 104.54 |
| Daily Pivot Point R3 | 105 |
More By This Author:
Natural Gas Futures - No Changes To The Consolidation ThemeNatural Gas Futures: Further Downside In Store
EUR/USD Price Analysis: Downward Bias Could Extend To 1.0516
Disclosure: Information on this article contains forward-looking statements that involve risks and uncertainties. Markets and instruments profiled on this page are for informational purposes ...
more


