
- DXY extends the bounce and reclaims the 102.00 mark and above.
- Next on the upside appears the 103.15/20 band.
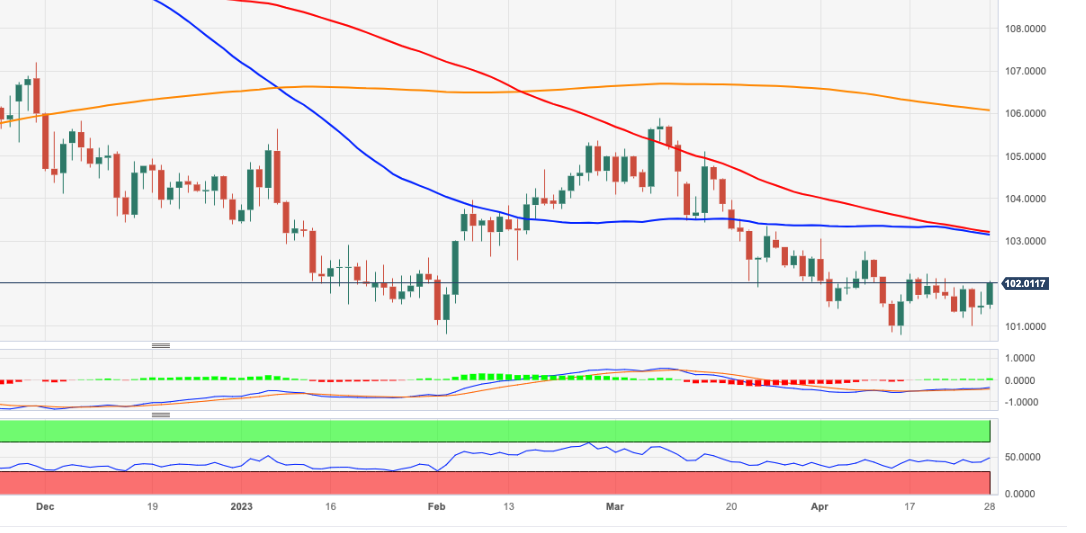
DXY adds to Thursday’s gains and surpasses the key barrier at 102.00 the figure at the end of the week.
In the meantime, the index remains broadly side-lined and with a downwards bias. That said, further upside should clear the 103.15/20 band, where the interim 55- and 100-day SMAs coincide to see the bearish perspective somewhat mitigated.
Looking at the broader picture, while below the 200-day SMA, today at 106.07, the outlook for the index is expected to remain negative.
DXY daily chart
(Click on image to enlarge)
Dollar Index Spot
| OVERVIEW | |
|---|---|
| Today last price | 102.03 |
| Today Daily Change | 64 |
| Today Daily Change % | 0.54 |
| Today daily open | 101.48 |
| TRENDS | |
|---|---|
| Daily SMA20 | 101.82 |
| Daily SMA50 | 103.14 |
| Daily SMA100 | 103.24 |
| Daily SMA200 | 106.18 |
| LEVELS | |
|---|---|
| Previous Daily High | 101.8 |
| Previous Daily Low | 101.28 |
| Previous Weekly High | 102.23 |
| Previous Weekly Low | 101.53 |
| Previous Monthly High | 105.89 |
| Previous Monthly Low | 101.92 |
| Daily Fibonacci 38.2% | 101.6 |
| Daily Fibonacci 61.8% | 101.48 |
| Daily Pivot Point S1 | 101.24 |
| Daily Pivot Point S2 | 101 |
| Daily Pivot Point S3 | 100.72 |
| Daily Pivot Point R1 | 101.76 |
| Daily Pivot Point R2 | 102.04 |
| Daily Pivot Point R3 | 102.29 |
More By This Author:
Crude Oil Futures: Room For Further Upside Near TermUSD Index Returns To The Positive Territory Near 101.70
USD Index Price Analysis: Further Losses Not Ruled Out


Comments
Log in or sign up to join the conversation.