
- DXY picks up upside traction and reverses two daily pullbacks in a row.
- The continuation of the rebound targets the 106.80 region.
DXY leaves behind the pessimism seen in the first half of the week and revisits the low-106.00s on Wednesday.
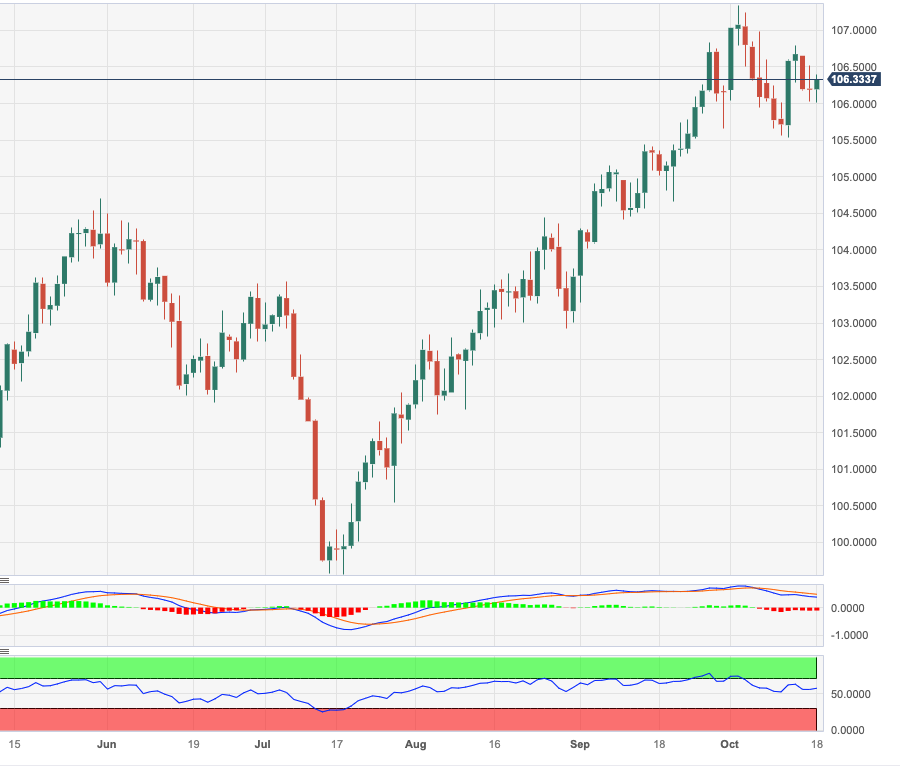
In case the bullish impulse accelerates, the surpass of the weekly high of 106.78 (October 12) could encourage the index to embark on a potential test of the 2023 top of 107.34 (October 3) in the short-term horizon.
In the meantime, while above the key 200-day SMA, today at 103.25, the outlook for the index is expected to remain constructive.
DXY daily chart
Dollar Index Spot
| OVERVIEW | |
|---|---|
| Today last price | 106.28 |
| Today Daily Change | 37 |
| Today Daily Change % | 0.08 |
| Today daily open | 106.19 |
| TRENDS | |
|---|---|
| Daily SMA20 | 106.2 |
| Daily SMA50 | 104.89 |
| Daily SMA100 | 103.6 |
| Daily SMA200 | 103.24 |
| LEVELS | |
|---|---|
| Previous Daily High | 106.52 |
| Previous Daily Low | 106.02 |
| Previous Weekly High | 106.79 |
| Previous Weekly Low | 105.54 |
| Previous Monthly High | 106.84 |
| Previous Monthly Low | 103.27 |
| Daily Fibonacci 38.2% | 106.22 |
| Daily Fibonacci 61.8% | 106.33 |
| Daily Pivot Point S1 | 105.97 |
| Daily Pivot Point S2 | 105.75 |
| Daily Pivot Point S3 | 105.47 |
| Daily Pivot Point R1 | 106.47 |
| Daily Pivot Point R2 | 106.75 |
| Daily Pivot Point R3 | 106.97 |
More By This Author:
EUR/JPY Price Analysis: No Changes To The Consolidation Theme So FarCrude Oil Futures: Further Upside Looks Not Favored
EUR/USD Price Analysis: Some Consolidation Appears On The Table


Comments
Log in or sign up to join the conversation.