
- DXY finally surpasses 104.00 and prints new two-month tops.
- Immediately to the upside emerges the 104.70 zone.
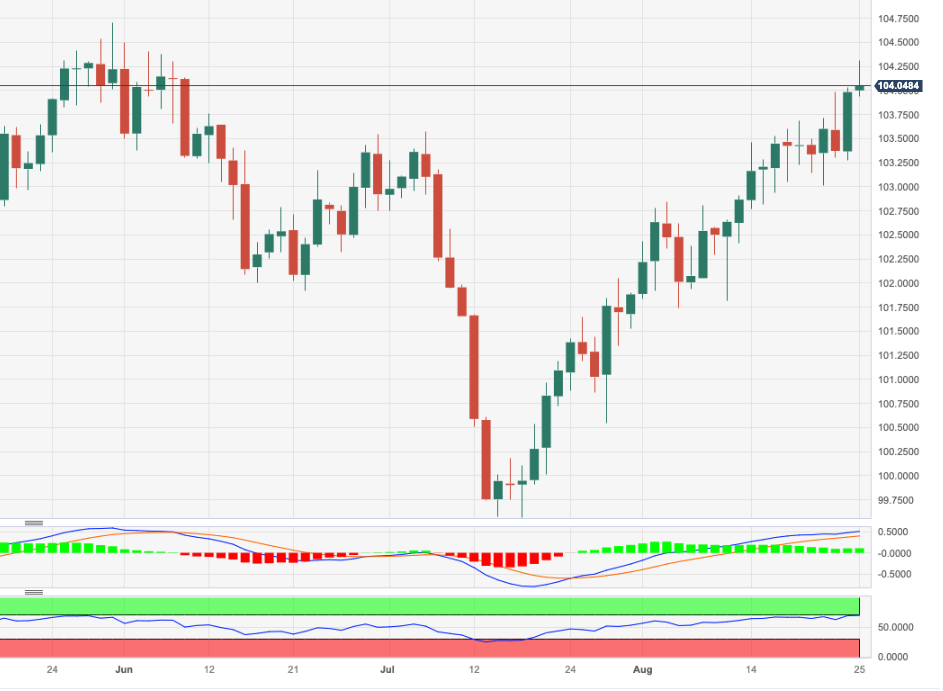
DXY picks up pace and advances to fresh tops around 104.30 at the end of the week.
A clear breakout of the 104.00 region could pave the way for a potential visit to the May top of 104.69 (May 31) prior to the 2023 peak of 105.88 (March 8) in the relatively short-term horizon.
While above the key 200-day SMA, today at 103.12, the outlook for the index is expected to shift to a more constructive one.
DXY daily chart
(Click on image to enlarge)
Dollar Index Spot
| OVERVIEW | |
|---|---|
| Today last price | 104.02 |
| Today Daily Change | 36 |
| Today Daily Change % | 0.04 |
| Today daily open | 103.98 |
| TRENDS | |
|---|---|
| Daily SMA20 | 102.83 |
| Daily SMA50 | 102.24 |
| Daily SMA100 | 102.43 |
| Daily SMA200 | 103.11 |
| LEVELS | |
|---|---|
| Previous Daily High | 104.03 |
| Previous Daily Low | 103.27 |
| Previous Weekly High | 103.68 |
| Previous Weekly Low | 102.77 |
| Previous Monthly High | 103.57 |
| Previous Monthly Low | 99.57 |
| Daily Fibonacci 38.2% | 103.74 |
| Daily Fibonacci 61.8% | 103.56 |
| Daily Pivot Point S1 | 103.49 |
| Daily Pivot Point S2 | 103.01 |
| Daily Pivot Point S3 | 102.74 |
| Daily Pivot Point R1 | 104.25 |
| Daily Pivot Point R2 | 104.52 |
| Daily Pivot Point R3 | 105 |
More By This Author:
EUR/JPY Price Analysis: No Changes To The Upside TargetNatural Gas Futures: Extra Rebound Seems Not Favored
EUR/JPY Price Analysis: Bulls Continue To Target 160.00


Comments
Log in or sign up to join the conversation.