
- DXY keeps the bearish note unchanged below 101.00.
- A deeper pullback could revisit the key 100.00 zone.
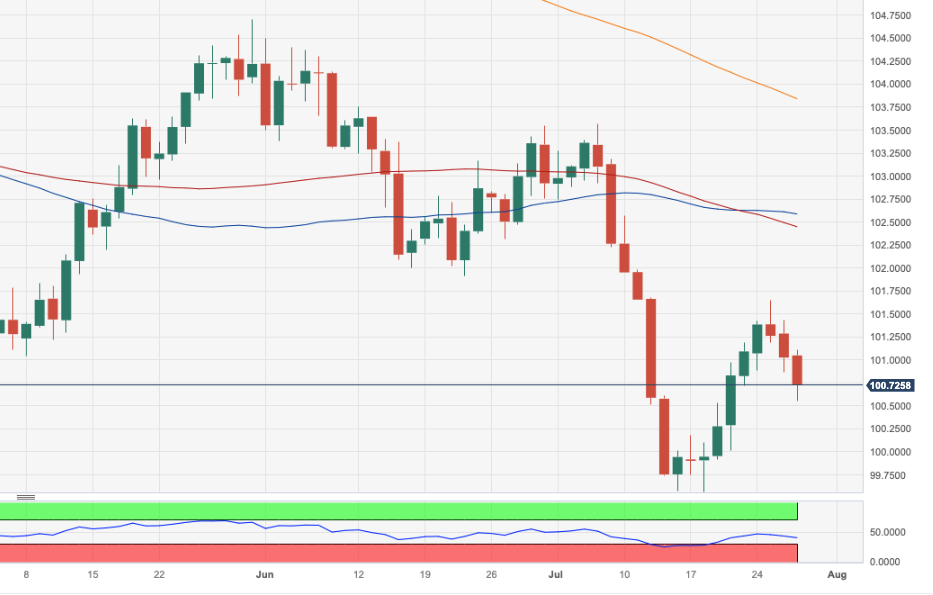
DXY drops for the third straight session and breaches the key support at 101.00 the figure to print new multi-day lows.
The continuation of the downward bias could initially drag the index to the 100.00 neighbourhood. The loss of the latter should leave the dollar vulnerable to a potential test of the 2023 low near 99.50 (July 14).
Looking at the broader picture, while below the 200-day SMA at 103.83 the outlook for the index is expected to remain negative.
DXY daily chart
(Click on image to enlarge)
Dollar Index Spot
| OVERVIEW | |
|---|---|
| Today last price | 100.65 |
| Today Daily Change | 55 |
| Today Daily Change % | -0.38 |
| Today daily open | 101.03 |
| TRENDS | |
|---|---|
| Daily SMA20 | 101.54 |
| Daily SMA50 | 102.62 |
| Daily SMA100 | 102.49 |
| Daily SMA200 | 103.62 |
| LEVELS | |
|---|---|
| Previous Daily High | 101.44 |
| Previous Daily Low | 100.86 |
| Previous Weekly High | 101.19 |
| Previous Weekly Low | 99.57 |
| Previous Monthly High | 104.5 |
| Previous Monthly Low | 101.92 |
| Daily Fibonacci 38.2% | 101.08 |
| Daily Fibonacci 61.8% | 101.22 |
| Daily Pivot Point S1 | 100.78 |
| Daily Pivot Point S2 | 100.54 |
| Daily Pivot Point S3 | 100.21 |
| Daily Pivot Point R1 | 101.36 |
| Daily Pivot Point R2 | 101.68 |
| Daily Pivot Point R3 | 101.93 |
More By This Author:
Natural Gas Futures: Near-Term Rebound LikelyNatural Gas Futures: Scope For A Near-Term Knee-Jerk
Natural Gas Futures: Probable Rebound In Store


Comments
Log in or sign up to join the conversation.