USD Index Price Analysis: A Drop To 104.40 Emerges On The Horizon
- DXY extends the weekly retracement below 105.00.
- Further south comes the weekly low near 104.40.
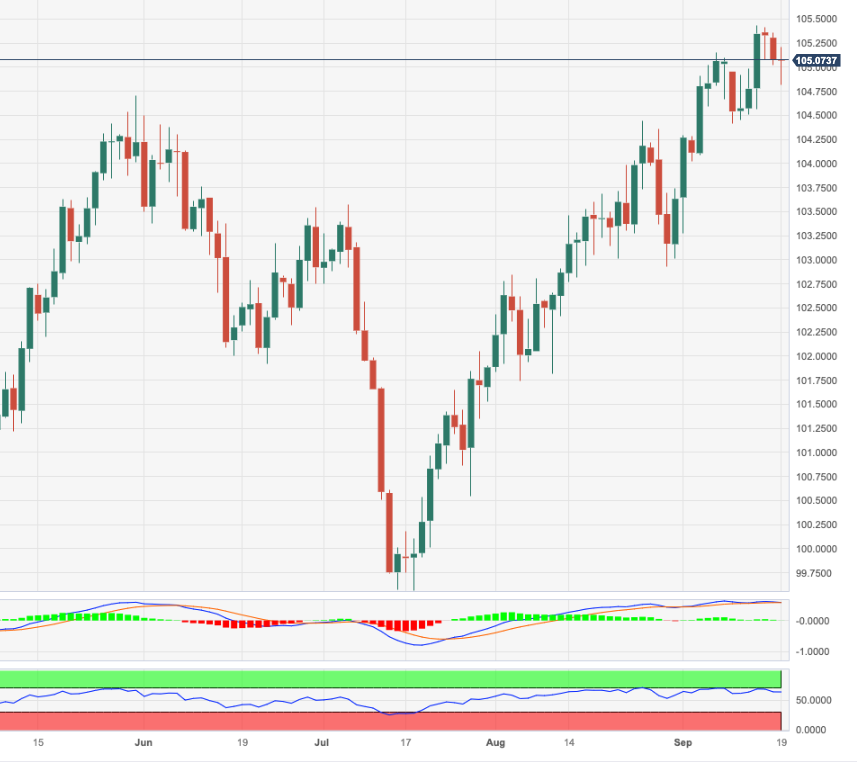
DXY has been shedding ground for the last three sessions and has opened the door to extra losses in the near term.
In case the corrective decline picks up further pace, the index could extend the drop to, initially, the weekly low of 104.42 (September 11). A sustained pullback below the latter could prompt the index to embark on a potential test of the critical 200-day SMA, today at 103.03.
While above the key 200-day SMA, the outlook for the index is expected to remain constructive.
DXY daily chart
(Click on image to enlarge)
Dollar Index Spot
| OVERVIEW | |
|---|---|
| Today last price | 104.96 |
| Today Daily Change | 39 |
| Today Daily Change % | -0.11 |
| Today daily open | 105.08 |
| TRENDS | |
|---|---|
| Daily SMA20 | 104.36 |
| Daily SMA50 | 102.84 |
| Daily SMA100 | 102.89 |
| Daily SMA200 | 103.03 |
| LEVELS | |
|---|---|
| Previous Daily High | 105.36 |
| Previous Daily Low | 105.02 |
| Previous Weekly High | 105.44 |
| Previous Weekly Low | 104.42 |
| Previous Monthly High | 104.44 |
| Previous Monthly Low | 101.74 |
| Daily Fibonacci 38.2% | 105.15 |
| Daily Fibonacci 61.8% | 105.23 |
| Daily Pivot Point S1 | 104.95 |
| Daily Pivot Point S2 | 104.82 |
| Daily Pivot Point S3 | 104.62 |
| Daily Pivot Point R1 | 105.28 |
| Daily Pivot Point R2 | 105.49 |
| Daily Pivot Point R3 | 105.62 |
More By This Author:
EUR/USD Price Analysis: Another Visit To The 1.0630 Region Is Not Ruled OutEUR/USD Price Analysis: Further Weakness Could Extend To 1.0516
Euro Clings To Daily Gains Around 1.0660, Dollar Remains Offered
Disclosure: Information on this article contains forward-looking statements that involve risks and uncertainties. Markets and instruments profiled on this page are for informational purposes ...
more


