
- DXY remains under pressure and briefly pierces 102.00.
- Extra losses could see the 101.00 zone revisited in the near term.
DXY now regains some composure following the earlier pullback to the sub-102.00 region, or new multi-week lows, on Thursday.
Despite the ongoing rebound, the index remains well under pressure. That said, there is the palpable probability that a deeper pullback could drag DXY to the area of lows seen in April and May around 101.00. Dow from here emerges the 2023 low around 100.80 recorded on April 14.
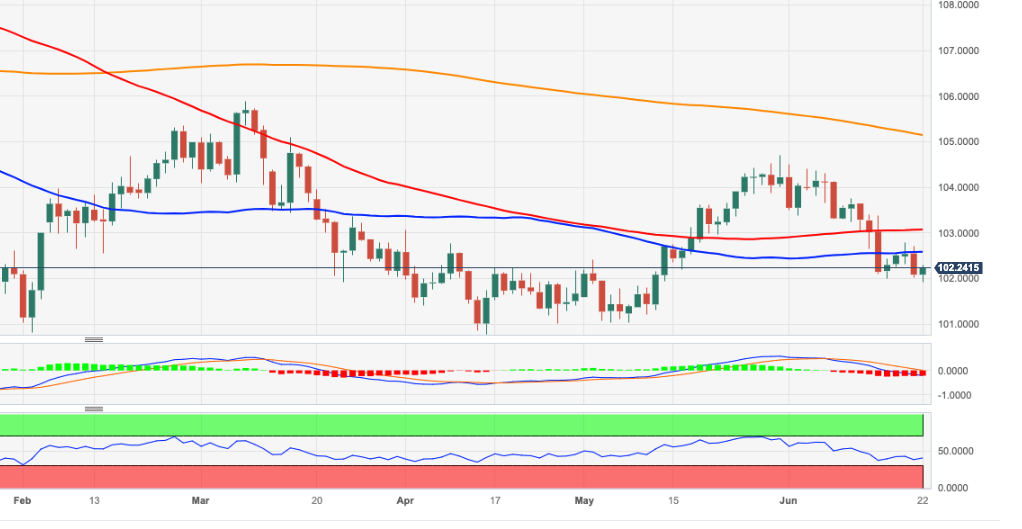
Looking at the broader picture, while below the 200-day SMA at 105.14 the outlook for the index is expected to remain negative.
DXY daily chart
(Click on image to enlarge)
Dollar Index Spot
| OVERVIEW | |
|---|---|
| Today last price | 102.29 |
| Today Daily Change | 38 |
| Today Daily Change % | 0.20 |
| Today daily open | 102.09 |
| TRENDS | |
|---|---|
| Daily SMA20 | 103.46 |
| Daily SMA50 | 102.63 |
| Daily SMA100 | 103.07 |
| Daily SMA200 | 104.88 |
| LEVELS | |
|---|---|
| Previous Daily High | 102.71 |
| Previous Daily Low | 102.02 |
| Previous Weekly High | 103.76 |
| Previous Weekly Low | 102.01 |
| Previous Monthly High | 104.7 |
| Previous Monthly Low | 101.03 |
| Daily Fibonacci 38.2% | 102.29 |
| Daily Fibonacci 61.8% | 102.45 |
| Daily Pivot Point S1 | 101.83 |
| Daily Pivot Point S2 | 101.58 |
| Daily Pivot Point S3 | 101.14 |
| Daily Pivot Point R1 | 102.53 |
| Daily Pivot Point R2 | 102.97 |
| Daily Pivot Point R3 | 103.22 |
More By This Author:
EUR/GBP Picks Up Pace And Climbs To 3-Week Highs Past 0.8600USD Index Price Analysis: Further Gains In Store Near Term
Crude Oil Futures: Extra Decline In The Pipeline


Comments
Log in or sign up to join the conversation.