
- DXY puts the 103.00 region to the test once again on Monday.
- The loss of this area could expose further retracements.
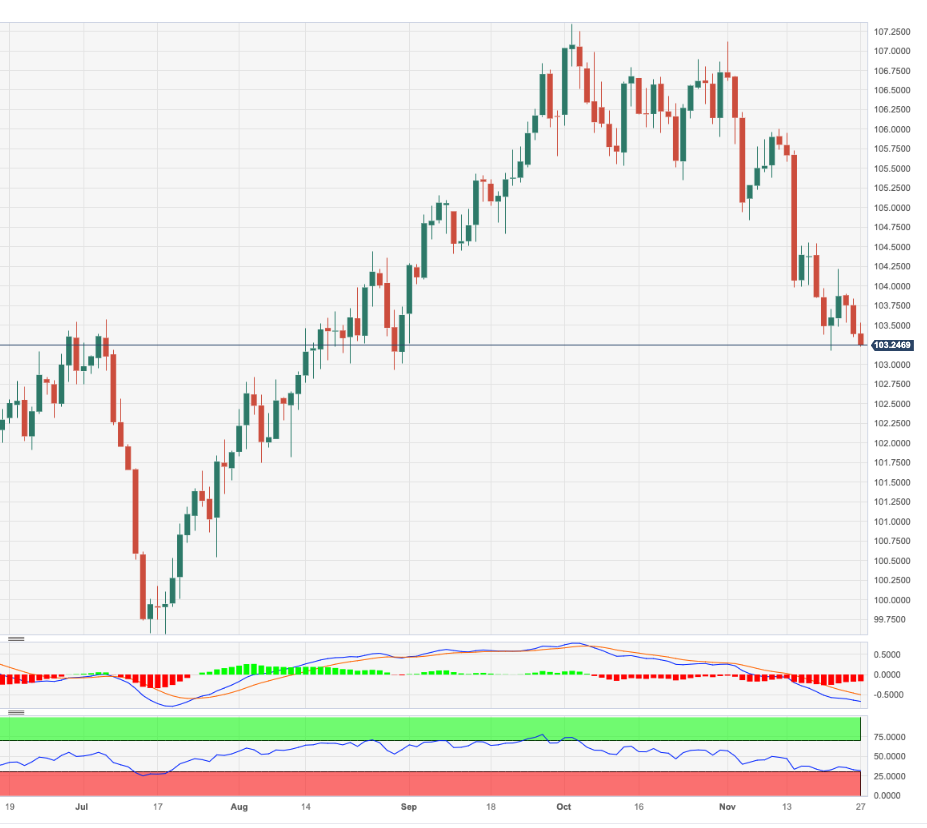
DXY retreats for the third consecutive session and approaches the area of three-month lows near 103.00 at the beginning of the week.
In case sellers push harder, the breakdown of the November low of 103.17 should leave the door open to extra losses in the near term. That said, the loss of the weekly low of 102.93 (August 30) could put a potential visit to the psychological 100.00 mark back on the radar.
In the meantime, while below the key 200-day SMA at 103.61, the outlook for the index is expected to remain bearish.
DXY daily chart
(Click on image to enlarge)
Dollar Index Spot
| OVERVIEW | |
|---|---|
| Today last price | 103.32 |
| Today Daily Change | 31 |
| Today Daily Change % | -0.07 |
| Today daily open | 103.39 |
| TRENDS | |
|---|---|
| Daily SMA20 | 104.96 |
| Daily SMA50 | 105.68 |
| Daily SMA100 | 104.23 |
| Daily SMA200 | 103.62 |
| LEVELS | |
|---|---|
| Previous Daily High | 103.84 |
| Previous Daily Low | 103.35 |
| Previous Weekly High | 104.22 |
| Previous Weekly Low | 103.18 |
| Previous Monthly High | 107.35 |
| Previous Monthly Low | 105.35 |
| Daily Fibonacci 38.2% | 103.54 |
| Daily Fibonacci 61.8% | 103.66 |
| Daily Pivot Point S1 | 103.21 |
| Daily Pivot Point S2 | 103.04 |
| Daily Pivot Point S3 | 102.73 |
| Daily Pivot Point R1 | 103.7 |
| Daily Pivot Point R2 | 104.02 |
| Daily Pivot Point R3 | 104.19 |
More By This Author:
Natural Gas Futures: Scope For Extra DeclineEuro Climbs To Daily Highs Near 1.0920 Prior To De Guindos Speech, US PMIs
Euro Keeps Familiar Range Above 1.0900 Ahead Of Lagarde, De Guindos Speeches


Comments
Log in or sign up to join the conversation.