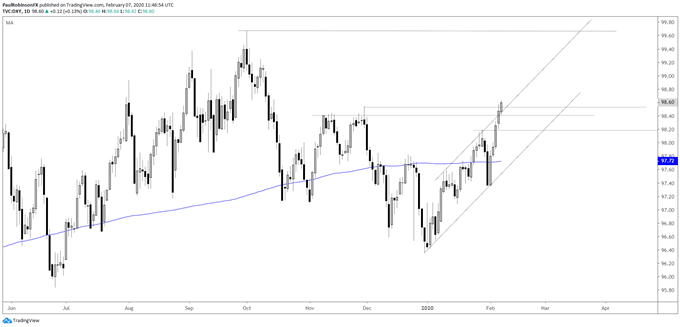
US Dollar Index (DXY) strength is continuing this morning for a 5th straight day, we’ll have to see if it can maintain or even further along following the release of NFPs. A close above 98.54 puts the index in open space to trade towards the October 1 high at 99.67 and the 100-line. There will likely be some bumps along the way as volatility remains low and keeps price action choppy, but the general trading bias is for more USD strength.
US DOLLAR INDEX (DXY) DAILY CHART (TREKKING HIGHER)
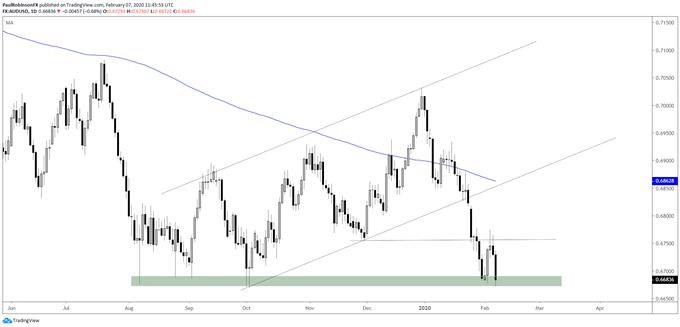
AUD/USD is extremely close to trading at new cycle lows below the 6670-mark from October. This is a big area around here with several powerful lows since August, thus making a break potentially important because at that point it will be trading at levels Aussie hasn’t seen since 2009. A bit of a hold and then break may make for a congestion pattern for traders to use as a set-up. Given the general trend and tone longs hold little appeal from where I sit.
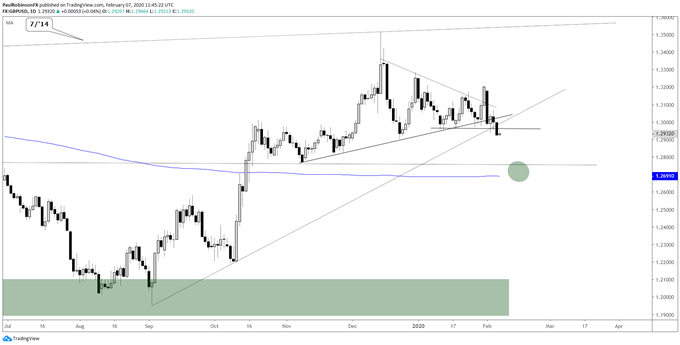
GBP/USD broke important support yesterday via the 12940/3000-area. The break gave it clearance below a trend-line from November and good short-term horizontal support. After the upside fake-out into Jan 31 and downside breakdown now developing, looking for selling to come in and take Cable to around the 200-day MA.
Disclaimer: DailyFX, the free news and research website from IG, is one of the world's leading sources for news and analysis on the currency, commodity and index trading community. With nine internationally-based analysts publishing over 30 articles and producing 5 video news updates daily, DailyFX offers in-depth coverage of price action, predictions of likely market moves, and exhaustive interpretations of salient economic and political developments. DailyFX is also home to one of the most powerful economic calendars available on the web, complete with advanced sorting capabilities, detailed descriptions of upcoming events on the economic docket, and projections of how economic report data will impact the markets. Combined with the free charts and live rate updates featured on DailyFX, the DailyFX economic calendar is an invaluable resource for traders who heavily rely on the news for their trading strategies. Additionally, DailyFX serves as a portal to one of the most vibrant online discussion forums in the forex trading community. Avoiding market noise and the irrelevant personal commentary that plague many forex blogs and forums, the DailyFX Forum has established a reputation as being a place where real traders go to talk about serious trading.
Any opinions, news, research, analyses, prices, or other information contained on dailyfx.com are provided as general market commentary and does not constitute investment advice. Dailyfx will not accept liability for any loss or damage, including without limitation to, any loss of profit, which may arise directly or indirectly from use of or reliance on such information.