

Image Source: Pixabay
- The US Dollar is a touch softer on Wednesday ahead of FOMC Minutes.
- Markets are easing their positions on the US Dollar after Fed’s Goolsbee calls for a rate cut.
- The US Dollar index retreats away from 106.00.
The US Dollar (USD) eases on Wednesday after surprise comments from US Federal Reserve Bank of Chicago President Austan Goolsbee in Sintra during the European Central Bank symposium. Goolsbee said that keeping rates steady while inflation is coming down should also be considered as tightening and is no longer needed, suggesting interest rate cuts on the table. Ahead of the Fed’s Federal Open Market Committee (FOMC) Minutes, a bold statement to make.
On the US economic front, the calendar is very crowded on Wednesday, with many data points being moved from Thursday due to the US public holiday. The main key element will be the ADP Employment Change number for June ahead of the US Nonfarm Payrolls print on Friday. Additionally, the FOMC Minutes for the June meeting will be released at the end of the day, and some volatility looks to be guaranteed.
Daily digest market movers: Goolsbee breaks ranks
- At 11:30 GMT, the Challenger Job Cuts for June will be released. The previous number was at 63,816.
- The June ADP Employment Change data will be released at 12:15 GMT. An increase of 160,000 is expected after the 152,000 seen in May.
- Weekly Jobless Claims are to come in at 12:30 GMT, exceptionally on Wednesday:
- Initial Jobless Claims for the week ending June 28 are expected to rise to 235,000 from 233,000 a week before.
- Continuing Jobless Claims were at 1.839 million, with no consensus number available for the week ending June 21.
- At 14:00 GMT, the Institute for Supply Management will release June’s Purchasing Managers Index (PMI) reading for the Services sector:
- The Employment Index was at 47.1 in May, with no forecast available for June.
- The New Orders Index was at 54.1 in May, with no forecast available for June.
- The ISM Services PMI is expected to ease to 52.5 in June from 53.8.
- The Prices Paid Index was at 58.1 in May, with no forecast available for June.
- On the Federal Reserve front, some communication on the docket:
- At 10:30 GMT, comments from the Federal Reserve Bank of New York President John Williams, who participates in a panel about drivers of equilibrium interest rates at the ECB Forum on central banking in Sintra, Portugal.
- At 18:00 GMT, the FOMC Minutes for the Federal Reserve’s June meeting will be released.
- European equities are flirting with a 1% increase on the day. US Futures are still looking for direction.
- The CME Fedwatch Tool is broadly backing a rate cut in September despite recent comments from Fed officials. The odds now stand at 59.9% for a 25-basis-point cut. A rate pause stands at a 34.7% chance, while a 50-basis-point rate cut has a slim 5.4% possibility.
- The US 10-year benchmark rate trades near 4.44%, near this week’s high.
US Dollar Index Technical Analysis: Minutes mixed
The US Dollar Index (DXY) is easing a touch after Fed member Goolsbee dissented from his fellow members by saying that keeping rates steady for longer is not helping anymore. His call for rate cuts is a welcomed change after hearing each and every FOMC member saying that rates will remain steady for longer. Rate cuts should see some weakening of the Greenback, and could mean that the DXY will not be making any new highs anytime soon.
On the upside, the pivotal level of 105.89 is a must-have for additional gains. Once a daily close has taken place above that level, marching above the red descending trend line in the chart below at 106.26 and the peak of April at 106.52 are the two main resistances ahead of a fresh nine-month high. That would be reached once 107.35 is broken to the upside.
On the downside, 105.53 is the first support ahead of a trifecta of Simple Moving Averages (SMA). Next down is the 55-day SMA at 105.24, safeguarding the 105.00 round figure. A touch lower, near 104.75 and 104.45, both the 100-day and the 200-day SMA form a double layer of protection to support any declines together with the green ascending trendline from last December.
(Click on image to enlarge)
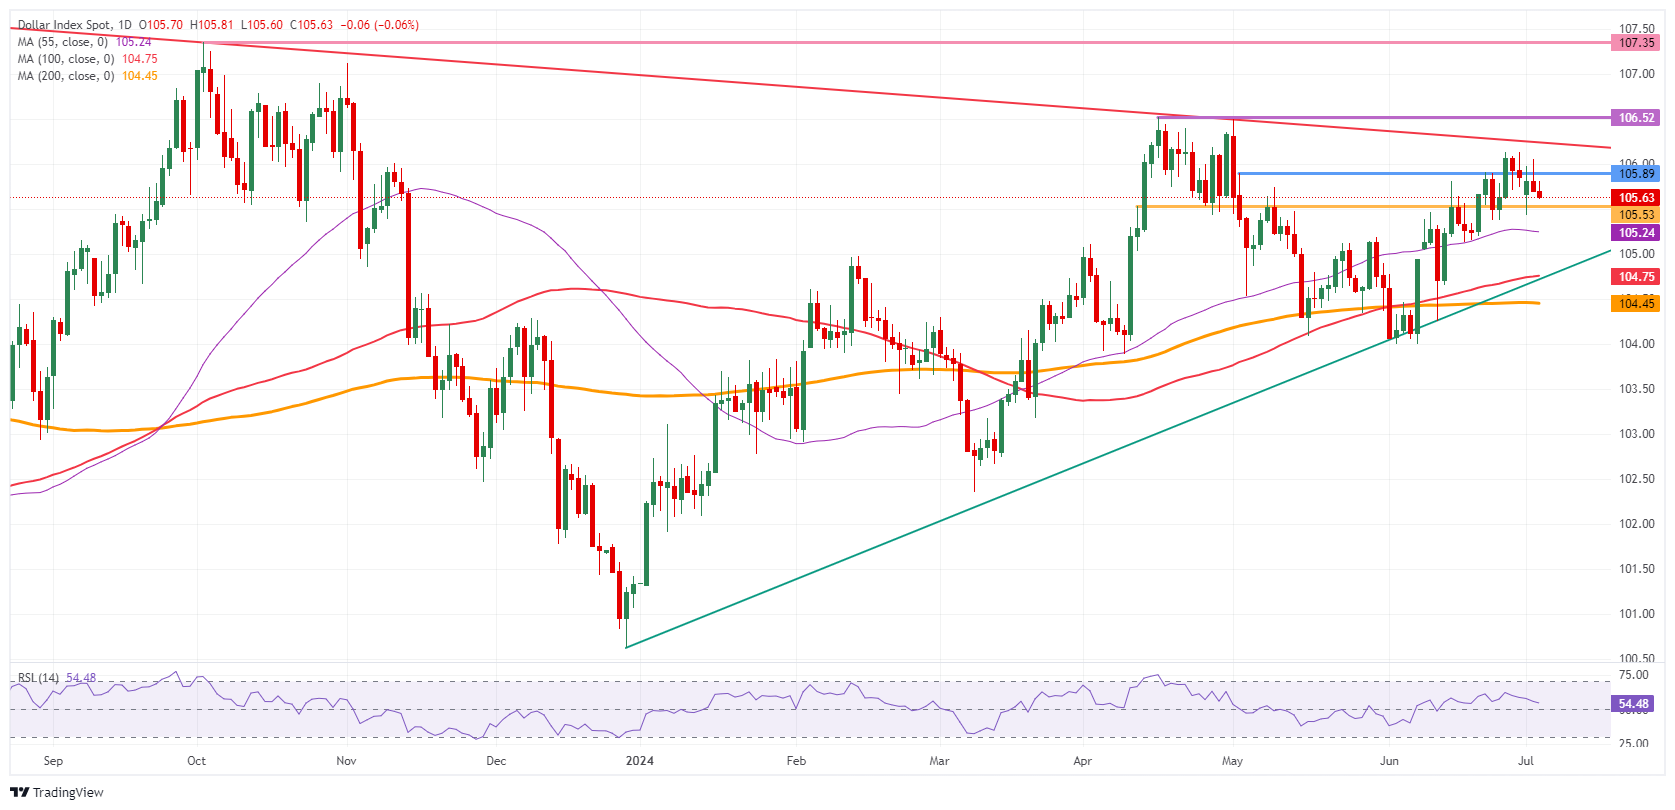
US Dollar Index: Daily Chart
More By This Author:
Natural Gas Sinks Over 1% With Selling Pressure RemainingUS Dollar Stretches Higher With Hawkish Fed Scaremongering Markets
Natural Gas Holds Above $3 As Europe Faces Global Supply Disruptions
Comments
Log in or sign up to join the conversation.