US Dollar Tanks After Not Hawkish Enough Fed Hike, Bank Of England Eyeing A Lift
The US Dollar sold off aggressively in the aftermath of the Federal Reserve’s 50 basis-point (bp) hike yesterday. Equities and bonds rallied while commodities were generally given a modest boost.
The Fed hosed down hopes of a 75 bp bump anytime soon. The market interpreted this as the central bank is not as hawkish as they had priced in. The Fed announced plans to sell Treasuries and mortgage-backed securities (MBS) accumulated throughout the pandemic stimulus measures.
Federal Reserve Chair Jerome Powell said that a 75 bp move is not something that the Federal Open Market Committee (FOMC) is actively considering.
In currency land, the Australian Dollar has been the largest beneficiary of US Dollar weakness after the RBA hiked by 25 bp on Tuesday. It rallied over 2% to be trading just under 0.7250.
The British Pound has given up some ground in Asia today ahead of the Bank of England rate decision. The market is anticipating a 25 bp lift there and the market will be looking for indications of the bank winding down its balance sheet.
Wall Street saw large gains with the Nasdaq leading the way, up 3.19% in the cash session. Futures markets are pointing to a steady start for the North American bourses today. APAC equity markets that were open saw only modest gains. Japan and Korea are on holiday.
As bonds rallied, their yields went south, with the 2-year part of the Treasury curve bearing the brunt of the Fed’s decision, down 14 bp to be near 2.65%.
Lower yields helped gold launch above US$ 1,900 for the first time this week. Crude oil also went higher, lifted by EU announcements placing further restrictions on Russian oil.
After the Bank of England rates decision, US jobs data will be released, and OPEC+ will be holding their regular meeting.
US Dollar Index (DXY) Technical Analysis
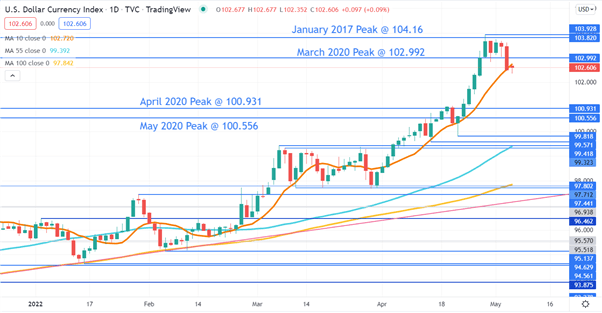
The US Dollar index made a 20-year high last week, but has now pulled back and is trading below the 10-day simple moving average (SMA). This could suggest that short-term momentum is pausing.
The recent peak and the January 2017 high of 103.93 and 103.82 respectively, may offer resistance.
On the downside, the pivot points at 100.93 and 100.55 might provide support. Further down, the previous lows of 99.81 and 99.57 could also provide support.
(Click on image to enlarge)

Disclosure: See the full disclosure for DailyFX here.


