
US Dollar Rises Ahead Of Jackson Hole, US-China Trade Talks
Higher yielding currencies and high beta assets are performing well at the start of the week as the US-China trade war is starting to take on a less combative tone. Global equity markets are in positive territory and sovereign bond yields are rising, moves that run counter to broader trends in recent weeks.
US-China Trade War Talks Set to Resume
There is a détente in the US-China trade war after the US tariffs at a clip of 10% on $300 billion of imported Chinese goods were pushed back from September 1 to December 15. Now, American-Sino negotiations are set to resume on a high level: over the weekend, US President Donald Trump said that “we are doing very well with China, and talking!”
Where does this leave us in the trade war news cycle? As we’ve previously noted, the cycle goes: (1) Trump administration is tough on China; (2) financial markets sell-off on trade war concerns; (3) Trump administration hints at US-China trade deal; (4) financial markets rally on trade deal hopes; (5) No deal materializes. We’re back in phase 4 right now.
USDCNH TECHNICAL ANALYSIS: DAILY PRICE CHART (NOVEMBER 2017 TO AUGUST 2019) (CHART 1)
(Click on image to enlarge)
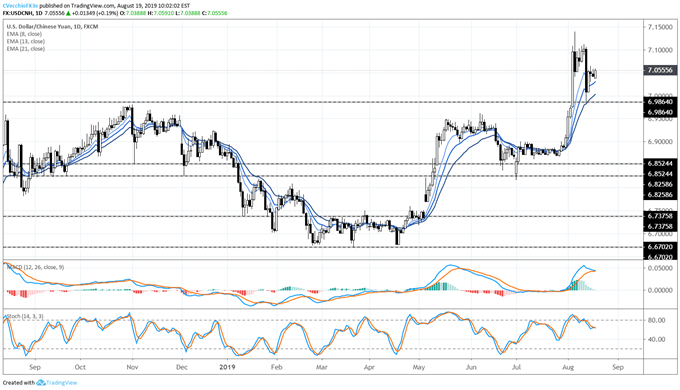
Rather than pay attention to tweets and promises, traders should pay closer attention to actions that are actually taken by American and Chinese policymakers. One such action to watch is where Chinese officials allow the USDCNH exchange rate to settle every day. Despite the fact that the September 1 tariffs were pushed back, USDCNH has not retraced its gains from the initial announcement; until USDCNH reverses back under 7.0000, there is little reason to think that the US-China trade war is on a path to resolution.
DXY INDEX TECHNICAL ANALYSIS: DAILY PRICE CHART (NOVEMBER 2017 TO AUGUST 2019) (CHART 2)
(Click on image to enlarge)
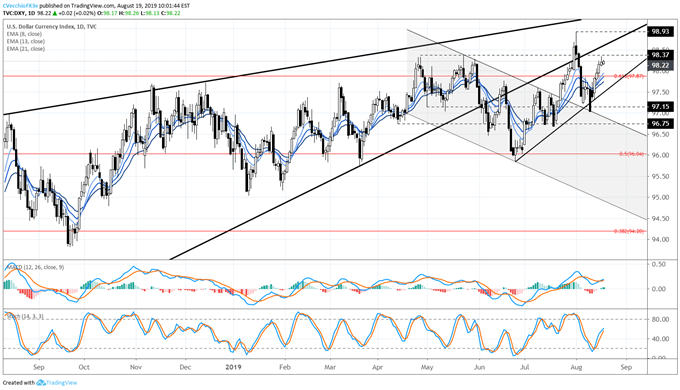
For the US Dollar (via the DXY Index), the rebound from the uptrend from the June and July swing lows has been maintained, neutralizing bearish momentum that developed at the start of August. But price action has continued to firm up, and as a result of the DXY Index’s momentum profile has turned more bullish. Price is trading above its daily 8-, 13-, and 21-EMA envelope, daily MACD is trending higher in bullish territory, and Slow Stochastics are now above below its median line.
DXY INDEX TECHNICAL ANALYSIS: DAILY PRICE CHART (JULY 2017 TO AUGUST 2019) (CHART 3)
(Click on image to enlarge)
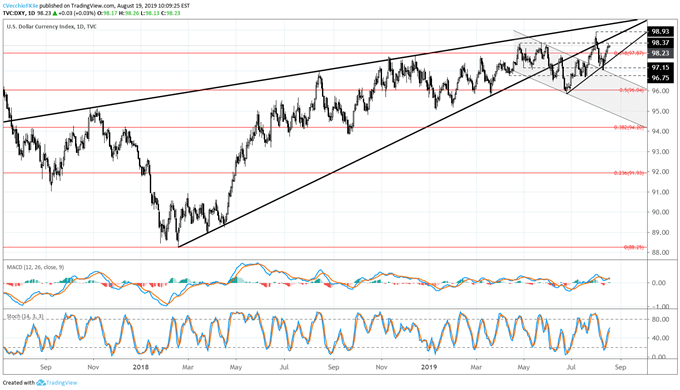
The big picture for the US Dollar (via the DXY Index) is potentially troublesome, particularly if the recent recovery fails. The DXY Index is again looking at a retest of the rising trendline from the February 2018, March 2018, and March 2019 low lows – the backbone of the entire bull move. Failure to retake the uptrend would suggest that the major topping potential for the US Dollar remains valid.


