
US Dollar Price Volatility Report: USD Eyes Data, Fed-Speak
We noted in our last US Dollar price volatility report that the greenback has lacked conviction over its next direction even despite a monetary policy update from the Federal Reserve. At the same time, US Dollar implied volatility readings have ebbed now that the immediate risk surrounding the September FOMC rate decision is in the rearview mirror. Looking ahead, however, a barrage of economic data releases in addition to speeches from Fed officials next week stand to spark USD price action.
US DOLLAR IMPLIED VOLATILITY & TRADING RANGES (1-WEEK)
(Click on image to enlarge)
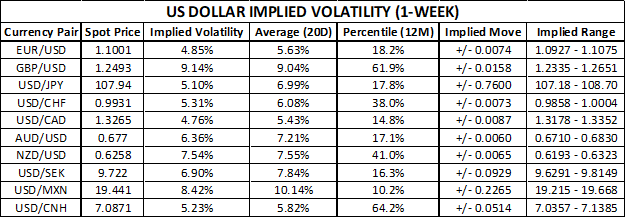
The DailyFX Economic Calendar details several US economic indicators on deck, which forex traders will weigh against the fundamental backdrop for the US Dollar as it relates to future Fed policy decisions. The FOMC decided to cut its benchmark interest rate for the second time this year citing “implications of global developments for the economic outlook as well as muted inflation pressures.”
The central bank also stated that it will closely monitor “measures of labor market conditions, indicators of inflation pressures and inflation expectations, and readings on financial and international developments.” As such, US manufacturing and services PMI data, as well as consumer confidence and core PCE inflation figures, will likely serve as the major catalysts behind the market’s Fed rate cut expectations, which, in turn, stand to help propel the US Dollar out of its recent choppy trading range.
US DOLLAR RISK REVERSALS (1-WEEK)
(Click on image to enlarge)
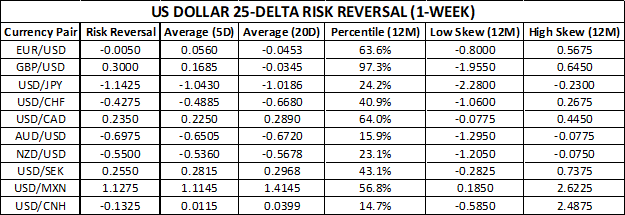
US Dollar risk reversals seem to hint at a growing bullish bias for the world’s reserve currency across 1-week forex options contracts on EURUSD, USDCHF, USDCAD, AUDUSD, NZDUSD, and USDMXN. On the other hand, GBPUSD, USDJPY, USDSEK, and USDCNH 1-week risk reversals point to currency traders insuring against US Dollar downside with respect to these pairs. Forex risk reversal metrics reflect the difference between the implied volatility on out-of-the-money call options relative to out-of-the-money put options (i.e. a positive risk reversal for a given currency pair suggests that traders are anticipating higher spot prices).
FED RATE CUT EXPECTATIONS (DECEMBER 2019)
(Click on image to enlarge)
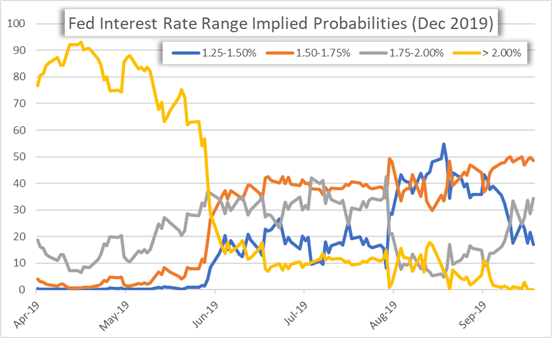
The convergence between the market’s priced rate cut expectations and projections from Fed officials is expected to overwhelmingly drive USD price action going forward. According to the latest overnight swaps data pulled from Bloomberg, there is a 65% probability that the Fed will cut rates by at least 25-basis points between now and year-end. This is a stark contrast to the revised economic projections released by FOMC members a few days ago, who listed the official median forecast for the Federal Funds Rate (FFR) at 1.9% seeing that we currently sit at a range between 1.75-2.00%.
That said, if next week’s high-impact data readings cross the wires above consensus estimates, the greenback will likely gain ground as it stands to undermine prospects for future dovish action from the Fed. Conversely, evidence of increasing downside risks to the US economy could fuel an acceleration in Fed rate cut bets, which would weigh negatively on the US Dollar.
At the same time, the US Dollar stands to gyrate in response to US-China trade war headlines. Also, FOMC member commentary from John Williams, James Bullard and Charles Evans will likely sway USD price action as markets digest additional insight from Fed officials on the central bank’s latest monetary policy stance. Williams and Evans voted in favor of the latest 0.25% FOMC rate cut while Bullard preferred a more aggressive 50bps rate cut.
DXY US DOLLAR INDEX PRICE CHART: DAILY TIME FRAME (APRIL 10, 2019 TO SEPTEMBER 20, 2019)
(Click on image to enlarge)
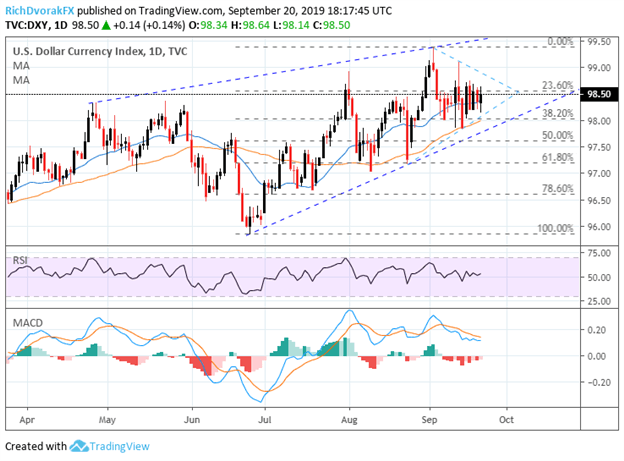
Chart created by @RichDvorakFX with TradingView
The technical backdrop for the US Dollar remains unchanged as the currency continues to drift sideways on balance. This has resulted in the recent emergence of a symmetrical triangle pattern on the DXY Index – a commonly referenced basket of major USD pairs. The symmetrical triangle pattern illustrated by the light blue trendlines extended from the series of lower highs and higher lows since August - in addition to the confluent support and resistance levels we have previously highlighted in our US Dollar price volatility reports published daily - is expected to keep the greenback anchored until a fundamental catalyst sparks its next major move.

Comments
 No Thumbs up yet!

