
US Dollar Price Volatility Report & Trading Ranges For Next Week
The US Dollar is starting to recede from its recent ramp this week, but the greenback remains broadly higher judging by the 0.64% rise in the DXY Index over the last 5 days. Friday’s slight pullback could be explained by this morning’s mixed bag data dump on US inflation and durable goods orders, which sent Treasury yields on a drift lower.
USD weakness was exacerbated slightly after downbeat headlines crossed the wires that US President Trump is weighing restrictions on capital flows to China in the latest trade war escalation. Although, given the greenback’s posturing as a safe haven currency, US Dollar downside has been stymied amid broad risk aversion in response to the aforementioned developments.
DXY US DOLLAR INDEX PRICE CHART: DAILY TIME FRAME (MARCH 27, 2019 TO SEPTEMBER 27, 2019)
(Click on image to enlarge)
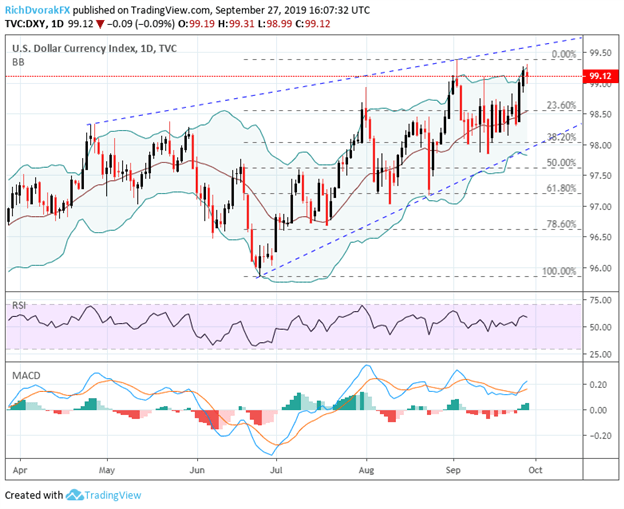
Chart created by @RichDvorakFX with TradingView
The confirmed breakout above technical resistance around the 98.50 price level underscored by the 23.6% Fibonacci retracement of the US Dollar’s bullish leg since late July could be looked to as support going forward if the DXY Index drifts lower next week. The upward sloping 20-day simple moving average could also help keep the US Dollar afloat going forward, which we have been highlighting regularly in our daily US Dollar price volatility report. Nearside resistance remains at the September 3 intraday swing high.
US DOLLAR – FOREX ECONOMIC CALENDAR
(Click on image to enlarge)
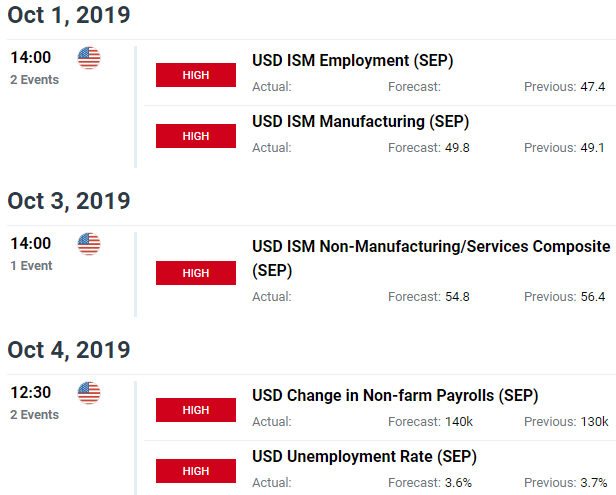
From a fundamental perspective, however, several catalysts for volatility rest ahead that possess serious potential to sway USD price action outlined on the DailyFX Economic Calendar. The major US economic indicators slated for release next week likely to be placed under the microscope by forex traders include ISM manufacturing and services PMIs on Tuesday and Thursday respectively in addition to nonfarm payrolls employment data on Friday.
Ultimately, better than expected data points could cause markets to unwind front-loaded FOMC rate cut expectations, which would likely steer the US Dollar higher, whereas disappointing reports could accelerate expectations for even looser Fed monetary policy and weigh negatively on the US Dollar.
US DOLLAR IMPLIED VOLATILITY & TRADING RANGES (1-WEEK)
(Click on image to enlarge)
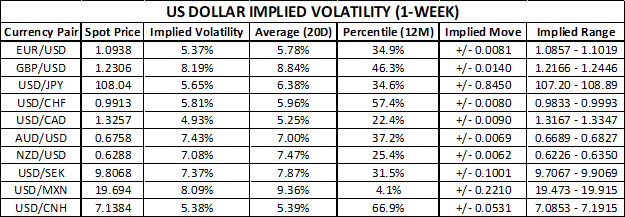
That said, 1-week implied volatility appears interestingly low when compared to historical averages and distributions (percentile rank) across major USD forex pairs. If risk aversion and market uncertainty heats up throughout next week, it could lead to a rise in implied volatility measures and may serve as a headwind to sentiment-geared currencies. Two markets, in particular, I’ll be watching closely will be the 2s10s Treasury yield curve spread – a popular recession indicator – as well as spot USDCNH seeing that the Chinese Yuan can serve as a US-China trade war gauge.
US DOLLAR RISK REVERSALS (1-WEEK)
(Click on image to enlarge)
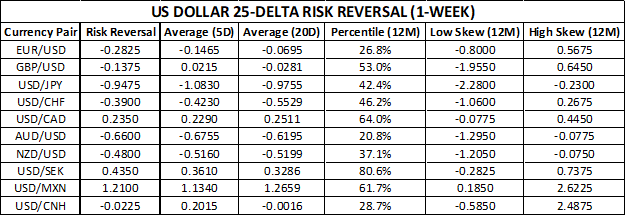
Broadly speaking, forex option traders are positioned with a bullish bias on the US Dollar headed into next week indicated by the latest USD risk reversal readings A risk reversal reading above zero indicates that the demand for call option volatility (upside protection) exceeds that of put option volatility (downside protection). For additional insight on market positioning and bullish or bearish biases, traders can turn to the IG Client Sentiment data, which is updated in real-time and covers several currency pairs, commodities, and equity indices.


