
US Dollar Price Outlook In EUR/USD, AUD/USD
Last week was big for the Greenback, as the US Dollar sank below a number of support levels on the heels of a dovish twist at the Fed. After carrying bullish overtones for the better part of the prior thirteen months, the US Dollar came into Q3 with an ascending wedge formation. Such a backdrop will often be approached with the aim of bullish continuation, and that led into breakouts in April and May as the US Dollar pushed up to a fresh yearly high at 98.33. But, the month of May was marked for change, as an outsized equity sell-off started to create worry at the Fed, and as the door opened into June, FOMC Chair Jerome Powell offered some supportive comments that gave the appearance that the bank may be nearing a dovish posture for the months ahead. In short order, the US Dollar folded-lower as equities began to trend-up again.
At this point, the US Dollar has taken out a number of key support levels. As looked at earlier in the month, the lack of enthusiasm from buyers near resistance led to the build of another formation; this time a rising wedge. Such a backdrop will often be approached in the opposite manner as the setup looked at above – as traders look for the lack of enthusiasm near resistance to, eventually, play-through for a break of support. That happened last week as USD fell out of the bottom of that formation.
US DOLLAR WEEKLY PRICE CHART
(Click on image to enlarge)
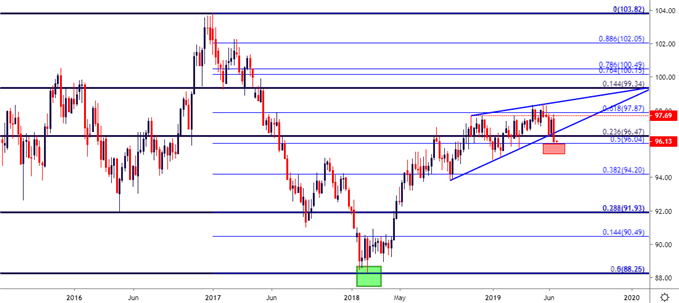
Chart prepared by James Stanley
The US Dollar is now testing a key level at 96.03, which is the 50% marker of the 2017-2018 sell-off. A bit lower is a prior swing-low around 95.68, followed by a big level of prior support around the 95.00 psychological level. Below that, a big confluent zone of Fibonacci support potential exists from 93.86-94.30.
For those looking to sell, a pullback to find resistance at the Fibonacci level of 96.47 can open the door for such a scenario. With such a rigid level of prior support being taken-out, this can be an interesting level to continue to watch for price action to revisit.
US DOLLAR DAILY PRICE CHART
(Click on image to enlarge)
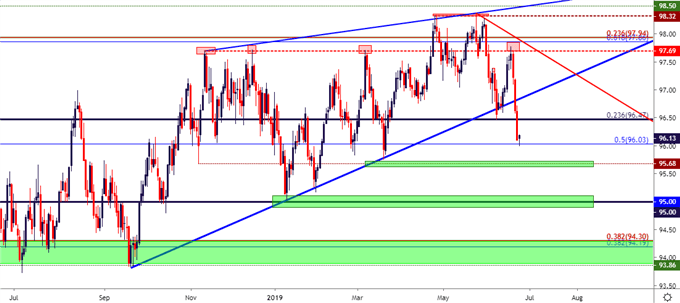
Chart prepared by James Stanley
EURUSD NEARS 1.1400, FRESH TWO-MONTH-HIGHS AFTER DOVISH DRAGHI
Coming into the month EURUSD was one of my favored spots to look for short-side USD exposure. And this wasn’t borne from any particular optimism around the Euro-zone as much as the length of time that the bearish side of the pair has been in-favor. Perhaps most importantly, the past few months have brought a variety of bearish triggers into the spotlight but, to date, Euro bears haven’t been able to make much of a mark. This produces a backdrop ripe for short-squeeze scenarios which is what appears that we have in-front of us. EURUSD is climbing to fresh two-month-highs, making a fast advance towards the longer-term zone of range resistance at 1.1448-1.1500. This move is likely taking a number of trailed stops out along the way; and once prices perch above the 1.1500 psychological level, the ground may be open for sellers to return.
EURUSD DAILY PRICE CHART
(Click on image to enlarge)
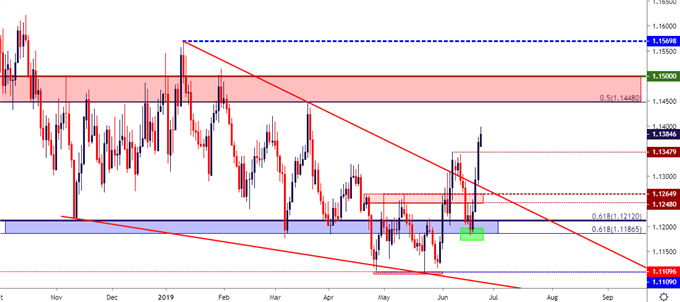
Chart prepared by James Stanley
AUDUSD TESTS RESISTANCE, SETS UP FADE POTENTIAL
For traders that would like to fade this recent run of USD-weakness, AUDUSD may remain of interest. It’s been a topsy-turvy month for the pair as a ‘rate cut rally’ earlier this month brought a big resistance zone into play that runs from .7000-.7019. I had looked at this area a couple of weeks ago for short-side setups in the pair, and this soon came into play after that RBA rate cut. But the next week-and-a-half after that were decidedly more bearish as AUDUSD plunged down to a fresh five-month-low, testing the .6830 area before selling pressure dried up.
As USD-weakness has taken-over around the FOMC flip, prices have retraced-higher and are currently testing resistance at a prior area of key support, taken from the .6955-.6960 area looked at last week.
For traders that want to buy the US Dollar, looking to fade this recent run of weakness, even if only for a short-term retracement in a longer-term theme, and AUDUSD can remain of interest as this resistance zone helps to hold the highs.
AUDUSD TWO-HOUR PRICE CHART
(Click on image to enlarge)
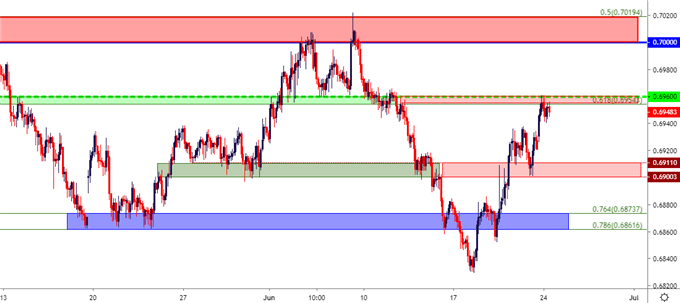
Chart prepared by James Stanley


