
US Dollar Talking Points:
- The US Dollar hurriedly jumped back above support at 109 after last week’s CPI report. The USD trickled higher, running into the 110.25 level again which helped to hold last week’s high.
- EUR/USD remains pegged near the parity level and USD/CAD just hit a major level of resistance. USD/JPY remains in the crosshairs between rates themes and speculation around the BoJ, which meets just after the FOMC on Wednesday of this week.
- The analysis contained in the article relies on price action and chart formations. To learn more about price action or chart patterns, check out our DailyFX Education section.
It’s Fed week and the US Dollar remains in focus after last week’s CPI report. Perhaps the most jarring part of that report was the first gain in Core CPI in months, which dashed some of the remaining hopes that inflation and, in turn, FOMC hawkishness may have already peaked. The Fed remains hawkish because inflation remains elevated, and in the words of former FOMC Vice Chair, Richard Clarida, the Fed is a single mandate operation at this point with inflation firmly in its crosshairs.
Now, with that being said, the Fed isn’t the only Central Bank taking on a hawkish approach. The ECB recently hiked by 75 basis points and the Bank of England continues to talk up rate hikes, as well. One of the few banks that isn’t posturing around more-hawkish monetary policy is the Bank of Japan, and the Yen has remained as a favored funding currency for carrying trades as US rates have continued their incline. The Fed has perhaps the unique ability to hike even more given that growth forecasts aren’t as dire as what’s showing around Europe, and that’s helped this backdrop that’s amounted to a significant run of USD-strength as many developed currencies dawdle near multi-decade lows.
US Dollar
The US Dollar put in a strong jump from support last week after the CPI report on Tuesday. Price catapulted right back up to the 110 psychological level which held the highs all the way into Friday trade, after which a quick attempt at a breakout found resistance at the same 110.24 level that had held the highs the week prior.
That does set up a potential double top that will remain a possibility until the high is taken out, thereby nullifying the potential formation. On a shorter-term basis, bulls have retained control and the door remains open for breakout potential. Higher-low support potential exists around prior resistance, taken from the long-term Fibonacci level at 109.14 up to the July swing high around the 109.27 level.
US Dollar Four-Hour Price Chart
(Click on image to enlarge)
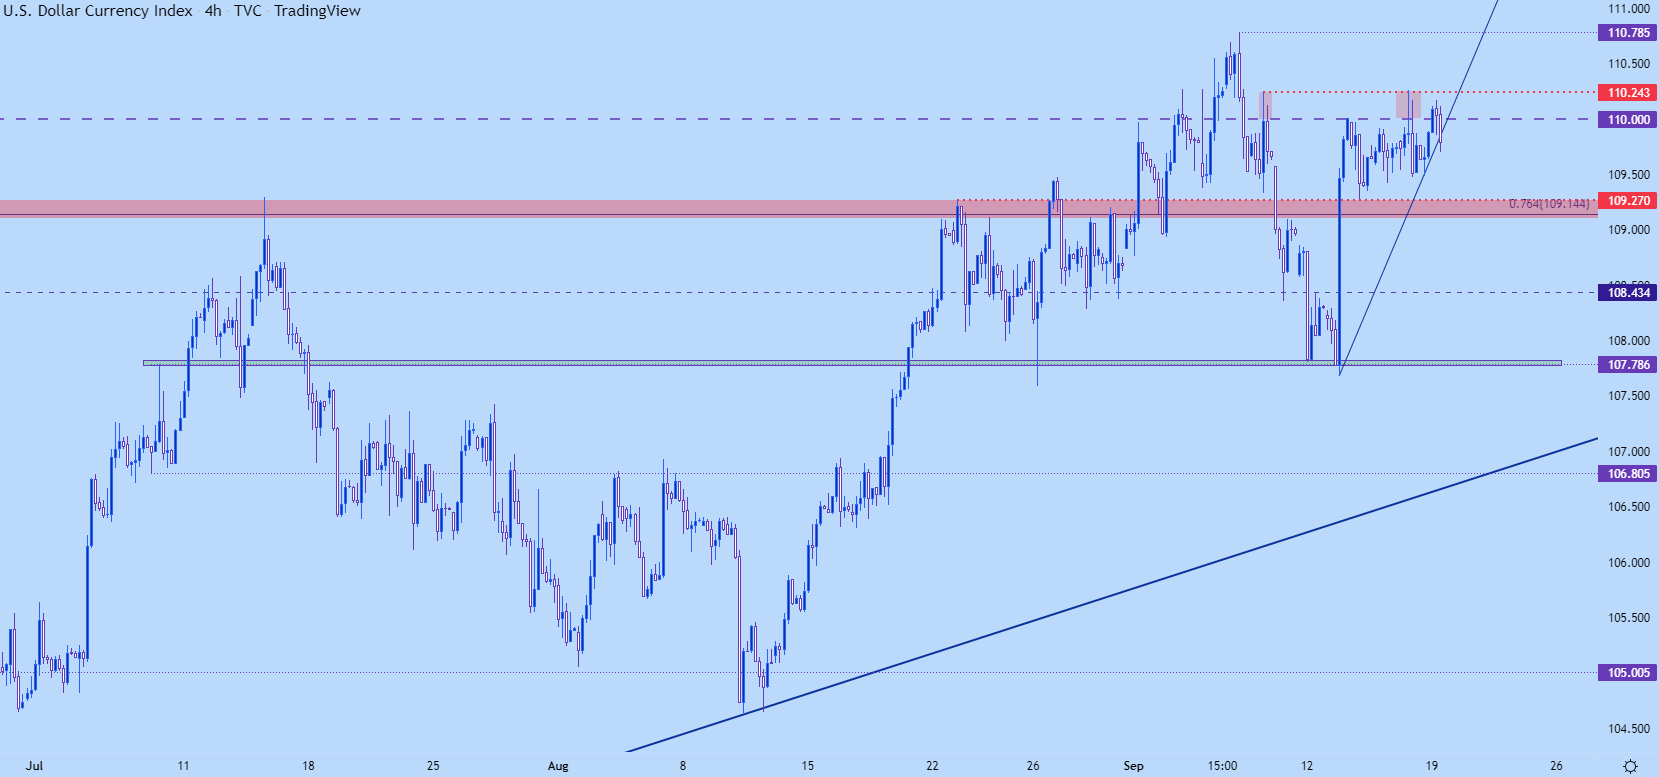
Chart prepared by James Stanley; USD, DXY on Tradingview
USD Shorter-Term
On a short-term basis, the ascending triangle is now in question as the price has slipped below the bullish trendline connecting last week’s swing low to the swing low from last night. This can keep the door open for shorter-term pullback themes. There’s a spot of short-term support around the 109.50 level but, bigger picture, it’s that same zone of interest at 109.14-109.27 that looms large.
US Dollar 30-Minute Chart
(Click on image to enlarge)
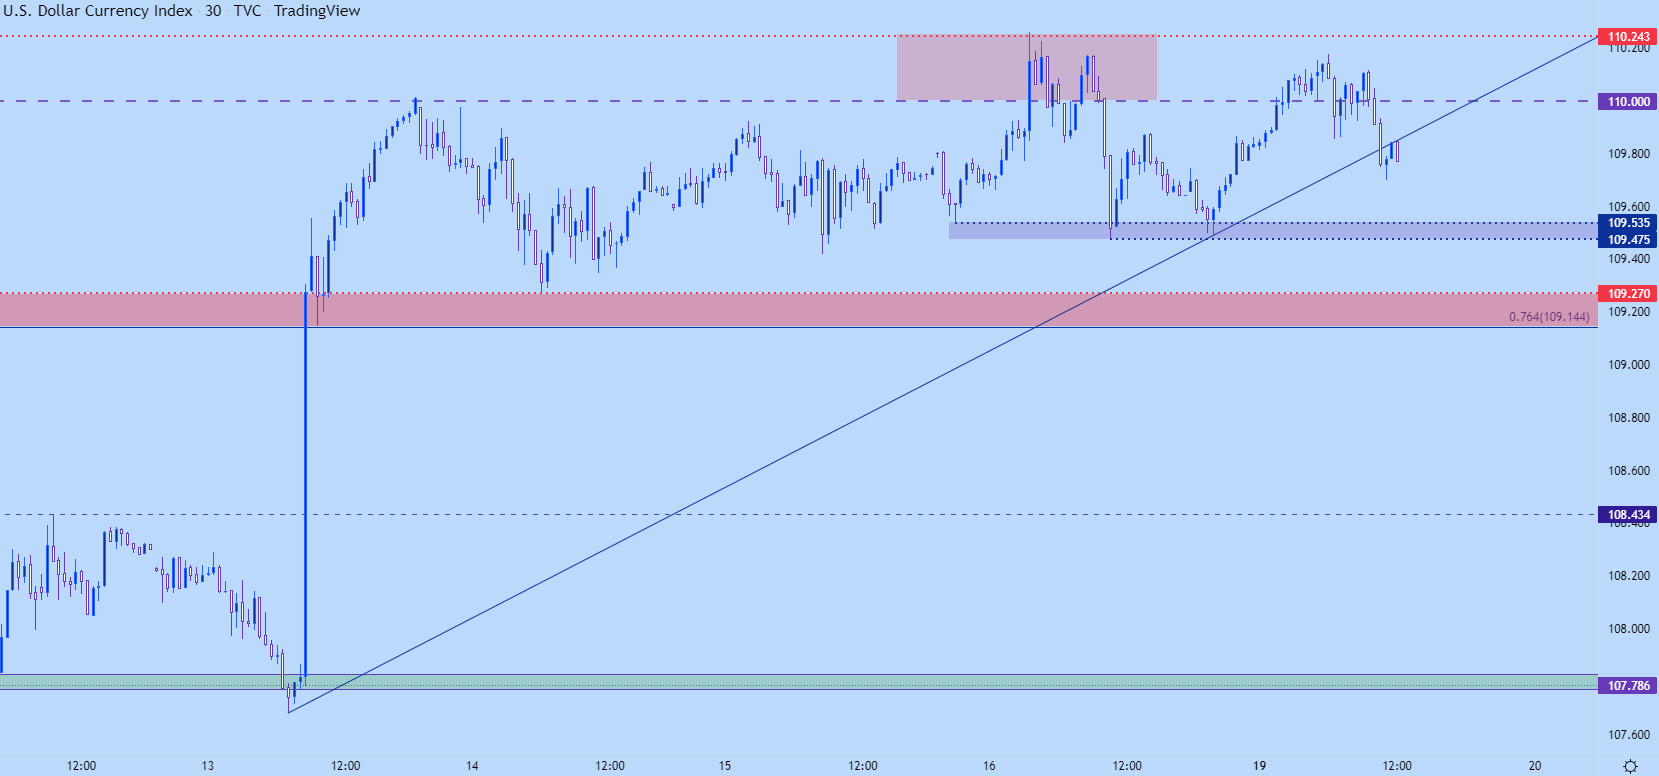
Chart prepared by James Stanley; USD, DXY on Tradingview
USD Bigger Picture
From the daily chart, we can see DXY having a tough time above the 110.00 level. This is a major psychological level and while we’ve had one daily close above this price, there’s been a little continuation and more recently, buyers haven’t been able to prod a lasting move above the big figure. Even last week’s inflation print – while it evoked a massive move, bulls couldn’t overcome the 110 handle.
So, this doesn’t necessarily mean that the trend is over or topped out; but it does mean that the matter will likely need some additional motivation and that might have some relationship to EUR/USD which I’ll look at below.
In USD, with resistance holding at a key spot, that keeps the door open for pullbacks going into FOMC. And if the Fed continues to get more vociferous in their hawkishness, that may be the motivation that bulls need to finally push above the 110 level – after which it can become higher-low support potential.
For invalidation of the bullish theme – a break of the bullish trendline would open that door. I have that projecting around a prior support-turned-resistance level of around 106.81.
US Dollar Daily Chart
(Click on image to enlarge)
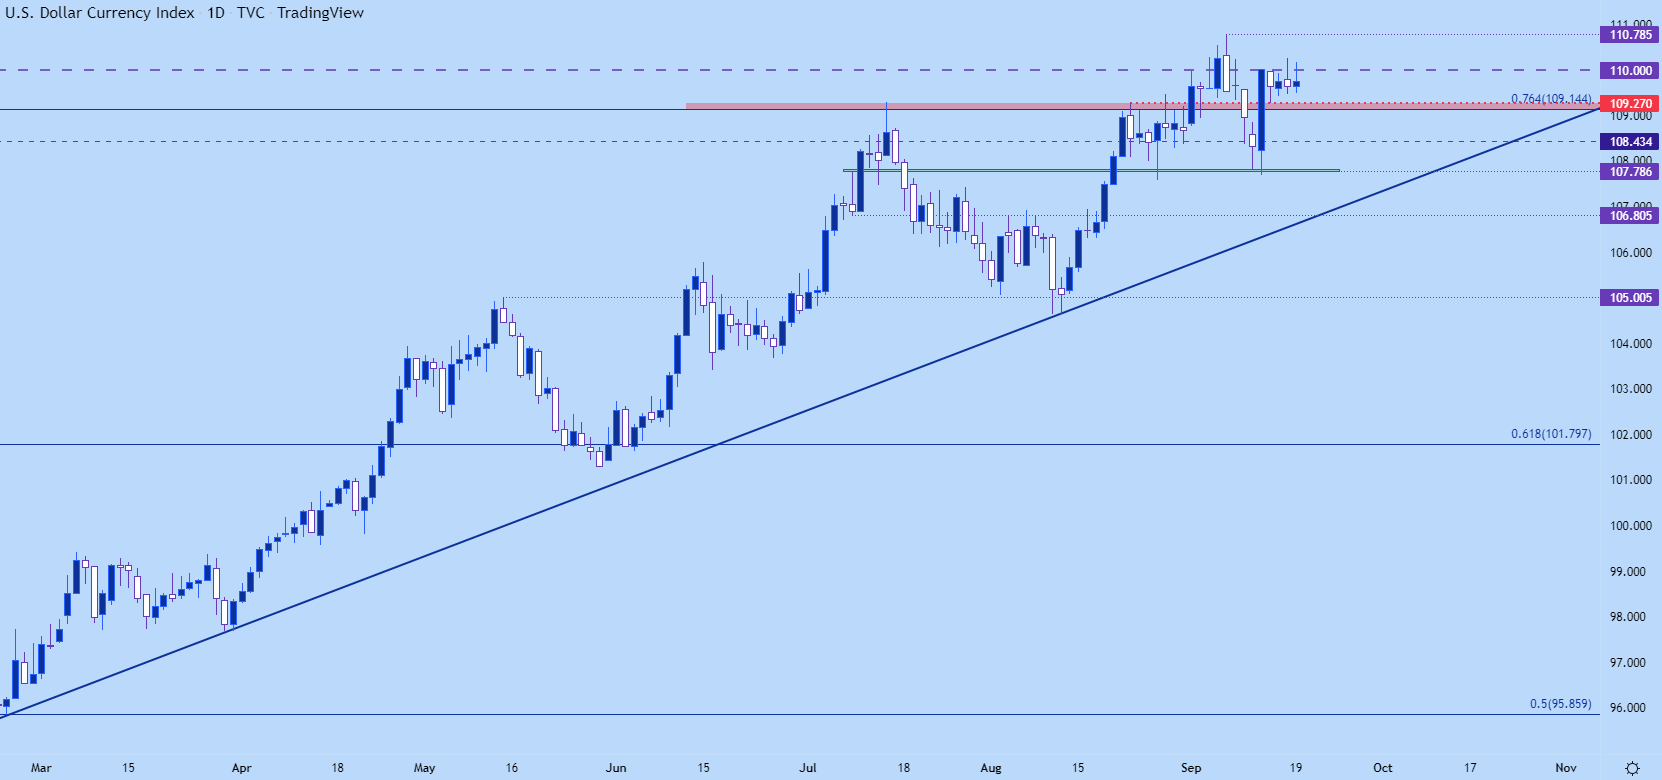
Chart prepared by James Stanley; USD, DXY on Tradingview
EUR/USD
The Euro remains in a dire position but that’s not really news at this point. The single currency has been punched continually by the US Dollar as witnessed by the bearish trend that’s been going on for fifteen months at this point.
Perhaps more disconcertingly, even as the ECB shifted into a much more-hawkish mode, EUR/USD has done little by way of response – merely oscillating around the same parity handle that’s been in play for a couple of months now. And as I’ve warned multiple times, a level of that nature should take some time to break down. In 2002, when EUR/USD was on the way up as the Euro was gaining global acceptance, EUR/USD took about six months to leave parity behind.
For this most recent iteration – parity started to come back into play again in July and there’s been a moderation in the sell-off, albeit slightly. There’s been a build of a falling wedge formation as bears have shown trepidation around parity. This keeps the door open for pullback potential, particularly if the Fed is able to maneuver a dovish presentation of an otherwise very-hawkish message.
Also of interest – while last week’s CPI slammed EUR/USD back below the big figure, notice what happened after – as a build of support showed around the .9950 level. From the weekly chart, this amounts to a possible higher low after a higher high ahead of that CPI release.
EUR/USD Daily Chart
(Click on image to enlarge)
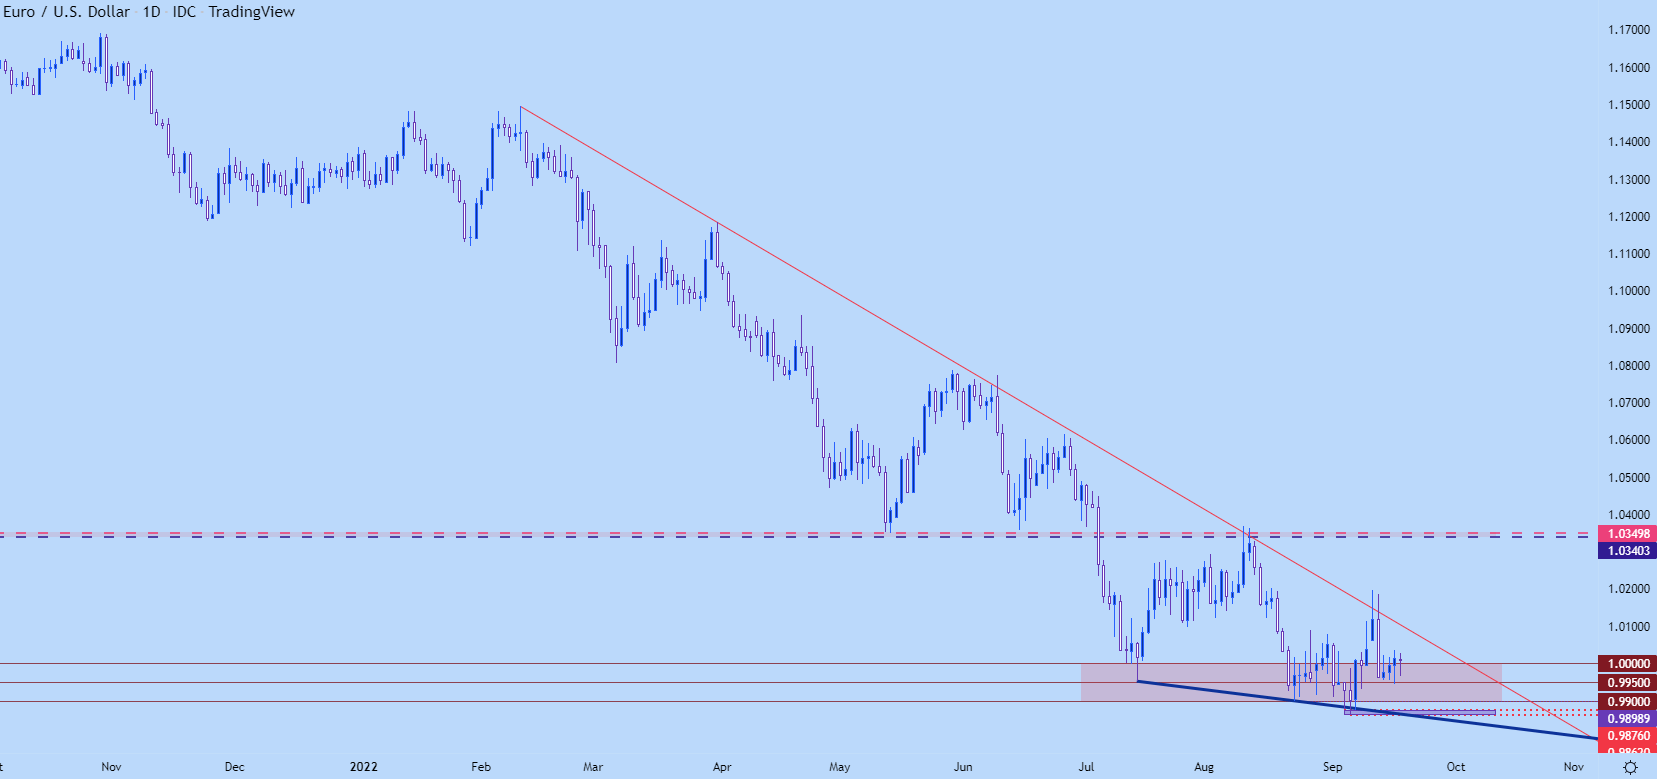
Chart prepared by James Stanley; EURUSD on Tradingview
GBP/USD
Cable is beleaguered last week the GBP/USD pair put in a bearish engulf along with a fresh 37-year low. There is a big of residual support playing in off of the prior swing-low from March of 2020, which is around the 1.1414 level. This can keep the door open for a bounce move up to short-term resistance, such as the 1.1500 or 1.1560 levels; and if buyers can put in a bit more stretch, there’s also resistance potential at 1.1600 and then 1.1700 psychological levels.
GBP/USD Weekly Price Chart
(Click on image to enlarge)
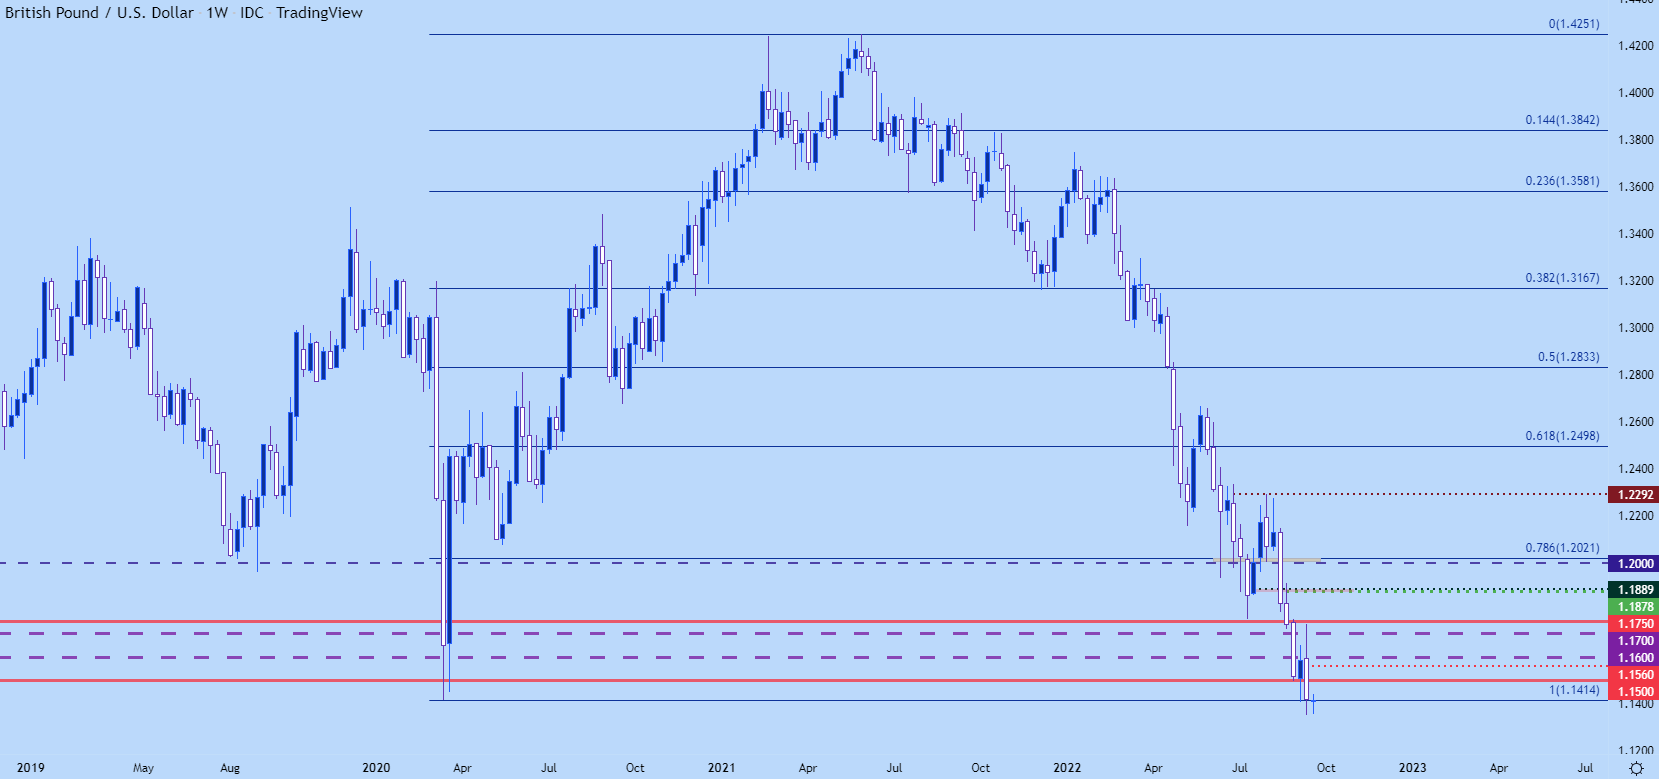
Chart prepared by James Stanley; GBPUSD on Tradingview
USD/CAD
USD/CAD has broken out to a fresh 22-month high this morning, testing the 50% retracement from the 2020-2021 major move for the first time since the low was set last year. There’s already been some runoff of that level with an exposed upper wick, and shorter-term, there’s support potential around the prior swing-high resistance, taken from the 1.3224 level. If a deeper pullback does show up, the same 1.3000 zone of resistance-turned-support remains as a point of interest for longer-term approaches.
USD/CAD Weekly Price Chart
(Click on image to enlarge)
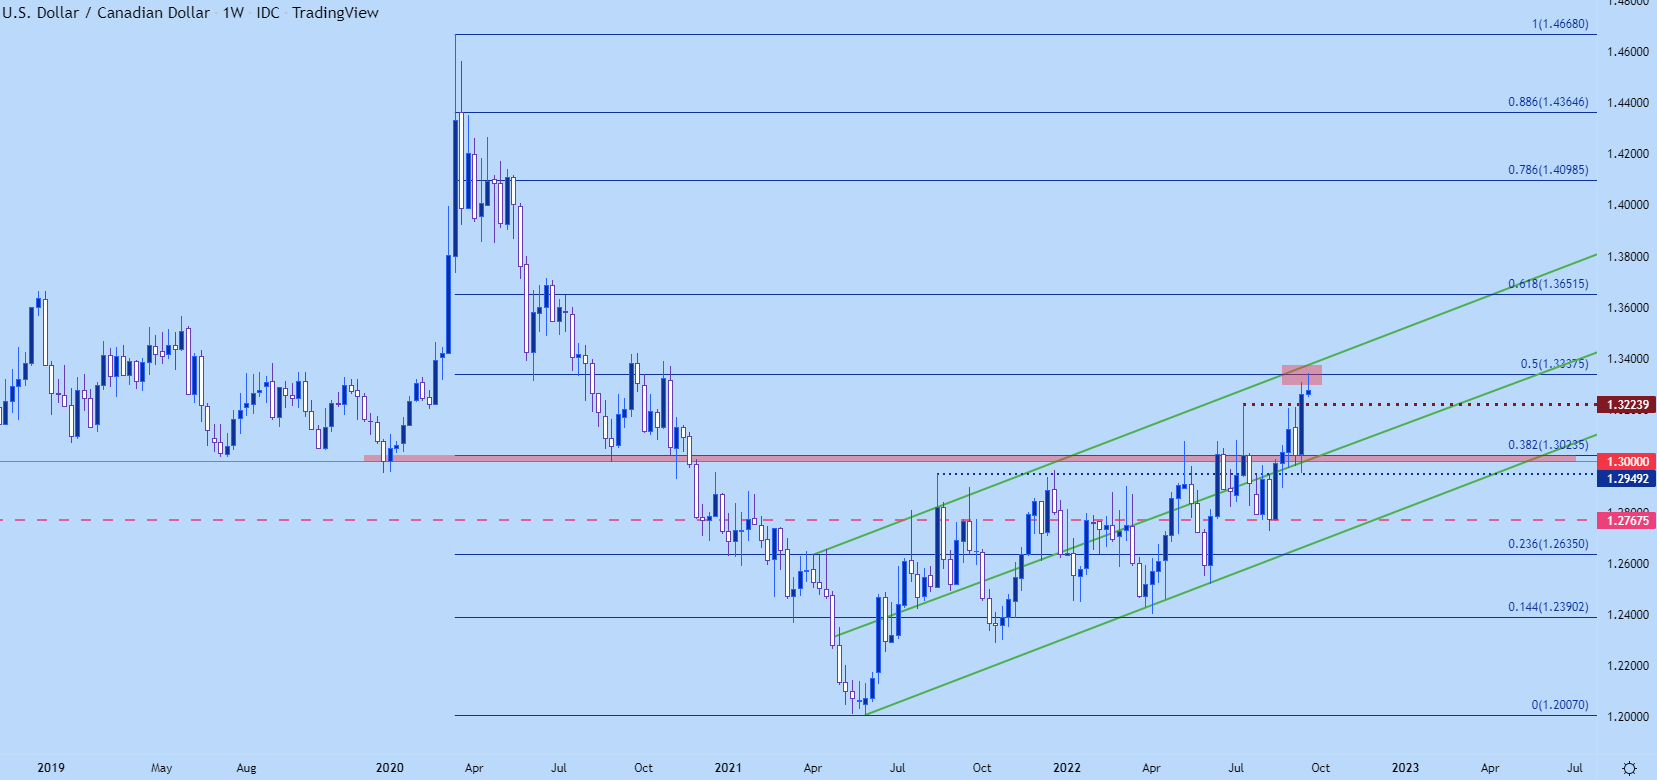
Chart prepared by James Stanley; USDCAD on Tradingview
USD/JPY
USD/JPY is meandering in a range after a failed run at resistance last week. The 145 psychological level remains the waypoint above the current price action as this price has yet to trade despite two close calls. Despite rampant speculation, there’s been no sign yet of any changes at the Bank of Japan, but we’ll hear more about that later this week when the BoJ meets for a rate decision, later on, Wednesday (Thursday morning in Asia).
In USD/JPY, rate hike themes can remain especially attractive given the prospect of the continued carry trade. There’s support potential around the 142.50 psychological level and below that, 141,60 comes into the picture. If that breaks, however, there could be some longer-term interest as that would highlight a double top formation from the two failed runs at the 145.00 psychological level, so 141.60 is big for USD/JPY trend themes.
USD/JPY Four-Hour Price Chart
(Click on image to enlarge)
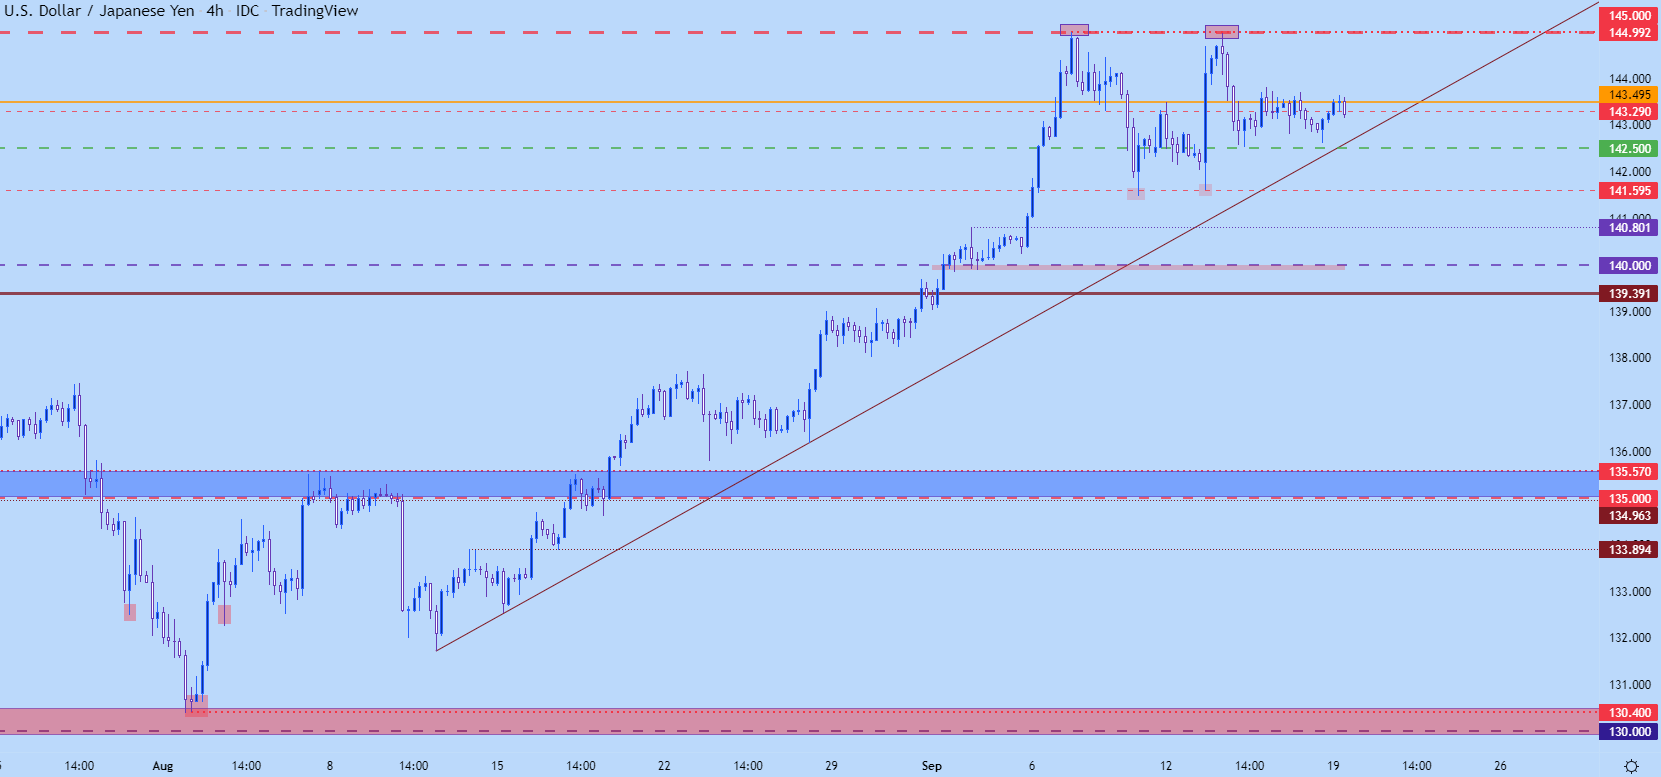
Chart prepared by James Stanley; USDJPY on Tradingview
More By This Author:
EUR/USD Dips Below Parity With Dollar Index Leading The WayGold Price Softens Ahead Of A Busy Week With Fed, BoE, SNB And BoJ Meetings
Global Equity Market Outlook: FOMC To Drive Market Sentiment In Week Ahead


Comments
Log in or sign up to join the conversation.