
US Dollar Is Moving As Anticipated In 2025

Image Source: Pixabay
The US Dollar Index – DXY is moving as anticipated from technical and Elliott wave perspectives since the start of 2025, and we have been talking a lot in the past months.
On January 03, we warned about a strong resistance for wave (C) of an (A)(B)(C) correction in wave B that can cause a reversal down for wave C in 2025.
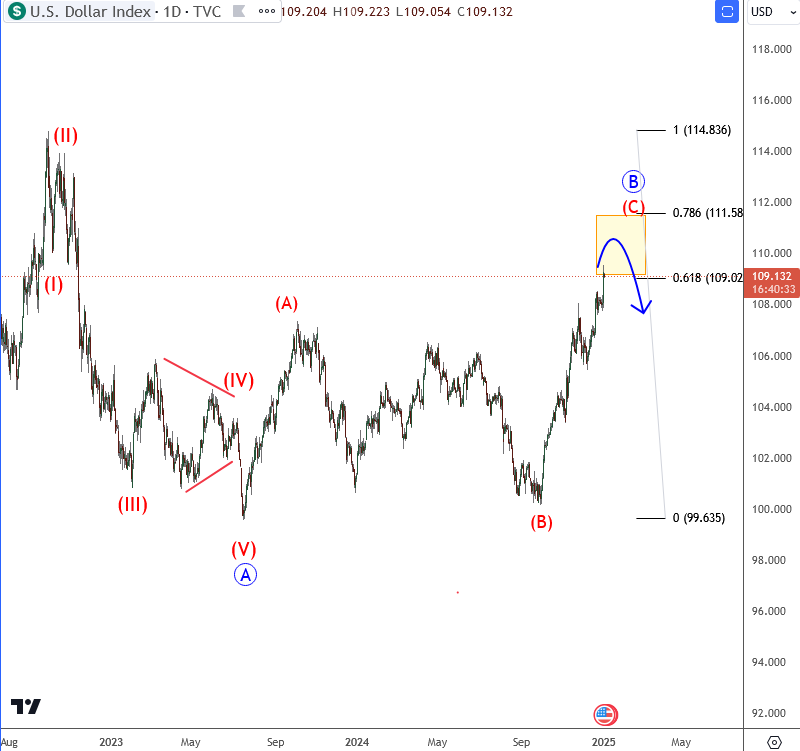
DXY Daily Chart From January 03 2025
Later on February 25, we got that reversal from projected resistance after a completed wedge pattern within wave (C) of B, so we pointed out that much more weakness is coming for a higher degree wave C.
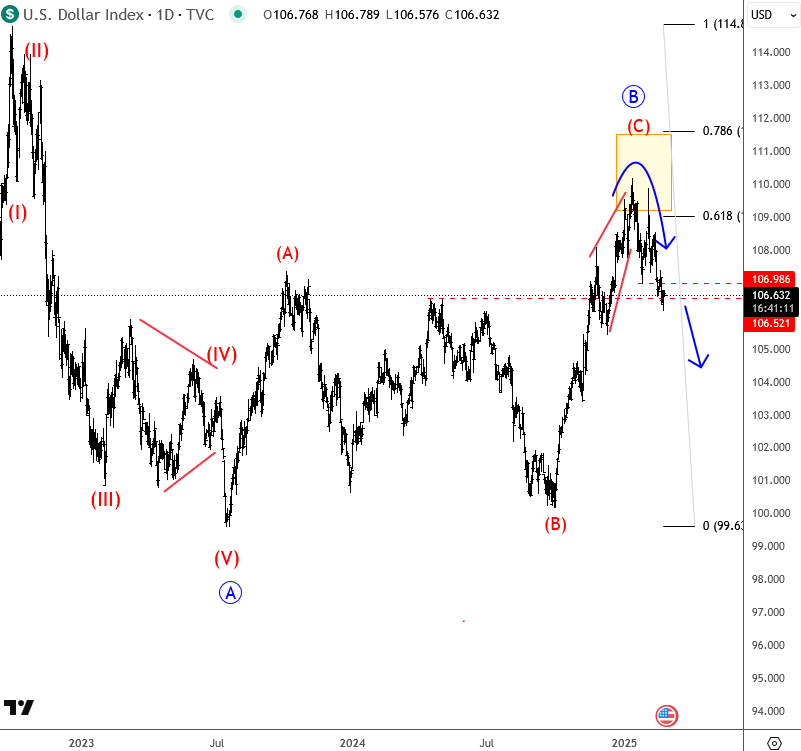
DXY Daily Chart From Feburary 25 2025
On March 06, it extended strongly lower, similar to back in 2017, when Trump also took office like this year, so wave C was in full progress and barely in the middle of an impulsive decline towards 2023 lows.
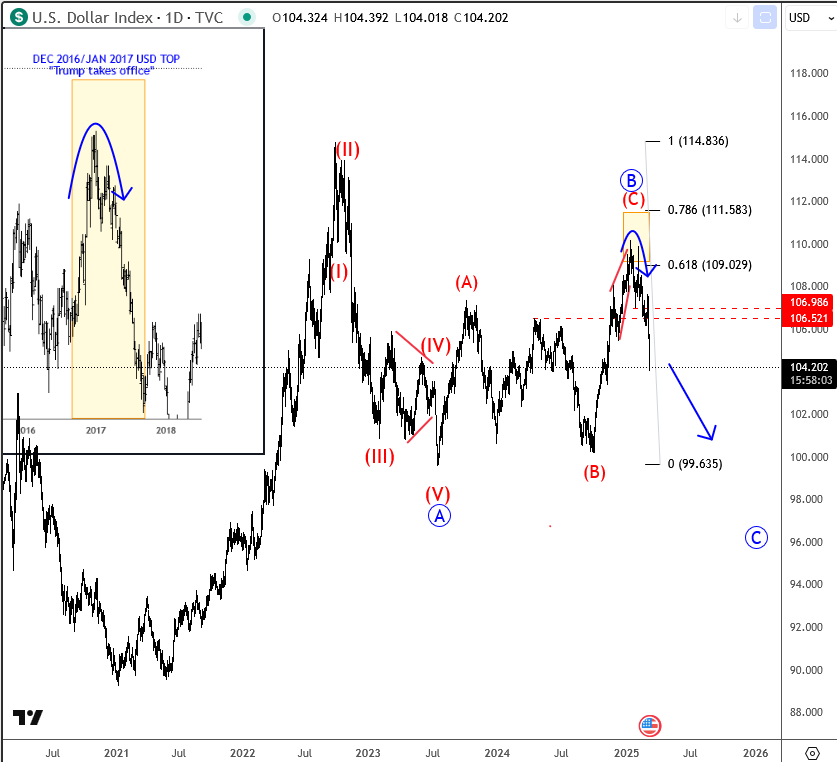
DXY Daily Chart From March 06 2025
As you can see now, in April, DXY is already back to 2023 lows and below 100 area for wave C as expected, but due to an unfinished lower degree five-wave bearish impulse, there can be room down to around 94 area, so after subwave 4 pullback, we may see moore weakness for subwave 5 of C.
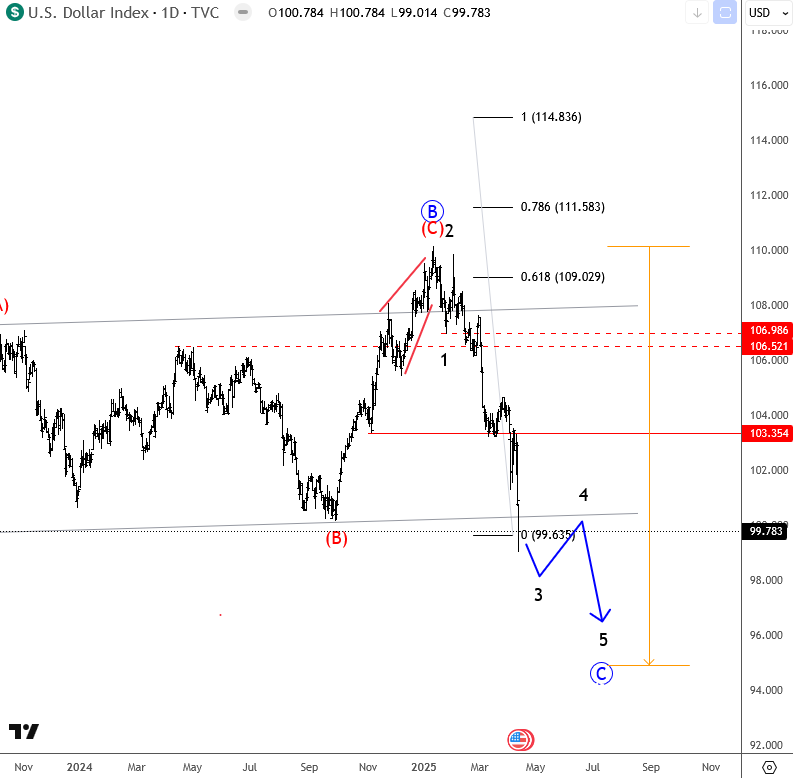
DXY Daily Chart From April 14 2025
For a detailed view and more analysis like this, you may want to watch our latest recording of a live webinar streamed on April 14, 2025: Direct Link.
More By This Author:
ALTcoin Dominance Is Waking Up
Ripple May Face Another Rally This Year
USDCAD Completes A Correction Within An Uptrend
Disclosure:


