
US Dollar Grasps On To Fibonacci Support As Yen Strength Remains
US DOLLAR HOLDS FIBONACCI SUPPORT AS YEAR-END NEARS
Next Monday marks the final day of 2018, and this has been a year that’s seen the US Dollar recover after a brutal year of 2017. Opening the door into 2019 will bring a host of concerns, chief of which are Fed policy and Trade Wars, and this will likely keep the US in the spotlight for the foreseeable future. As the final days of 2018 approach, the US Dollar is holding on to a key area of support as taken from the 23.6% Fibonacci retracement of the 2011-2017 major move. This comes after last week’s FOMC-fueled break-below the bullish channel that’s been in play for most of Q4.
US DOLLAR DAILY PRICE CHART
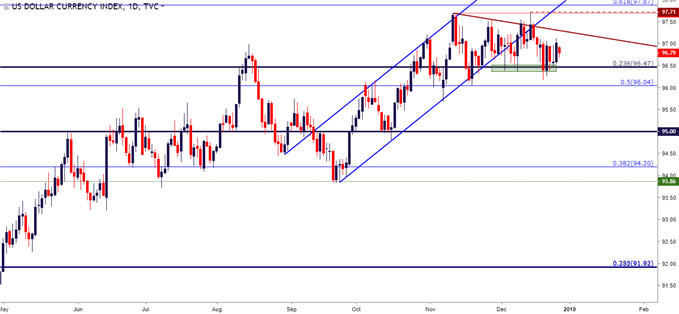
Chart prepared by James Stanley
EUR/USD REMAINS IN CONGESTION AFTER LAST WEEK’S TEST OF RESISTANCE
The congestion pattern in EUR/USD price action continues as the pair has seen prices soften back into the range that’s been in play for the past two months. EUR/USD came into Q4 hard-charging lower on the charts, soon finding support just ahead of the key Fibonacci level at 1.1212, which is the 61.8% marker of the 2000-2008 major move. Since then, prices have been bound between the resistance zone at 1.1448-1.1500 and support around that Fibonacci level.
The big question around the pair as 2019 approaches is whether strength returns, reminiscent of 2017 when the Euro was surging through most of the year on the prospect of the ECB ending bond purchases as part of their QE program. Now that the bank has made that formal announcement, and now that there is a bit of calm in the situation between Italy and the European Commission, the door may soon be re-opening to patterns of strength in the single currency.
In EUR/USD, a break above this resistance zone can make the prospect of bullish strategies in the pair begin to look more attractive, as discussed in this week’s FX Setups of the Week.
EUR/USD DAILY PRICE CHART
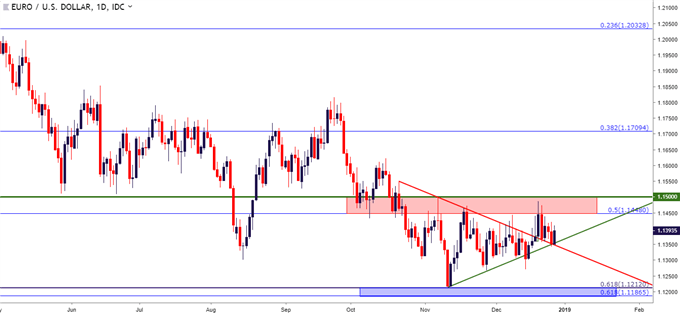
Chart prepared by James Stanley
USD/JPY BOUNCE FROM 110.00 FINDS SELLERS AGAIN
Going along with last week’s run of risk aversion has been significant strength in Japanese Yen, with the pair breaking below a bullish channel that’s been in-play since May of this year, and prices pushing all the way down to the 110.00 handle. That Tuesday test led into a mild bounce, but so far sellers have pounced to push prices back-below the Fibonacci level at 110.86.
This can keep the pair as one of the more attractive short-side USD setups as the page turns into 2019. In this week’s FX Setups, I wanted to see prices recover a bit more before bearish strategies could be re-employed, and for that, I was looking at resistance around prior support in the zone that runs from 112.20-112.50.
USD/JPY DAILY PRICE CHART
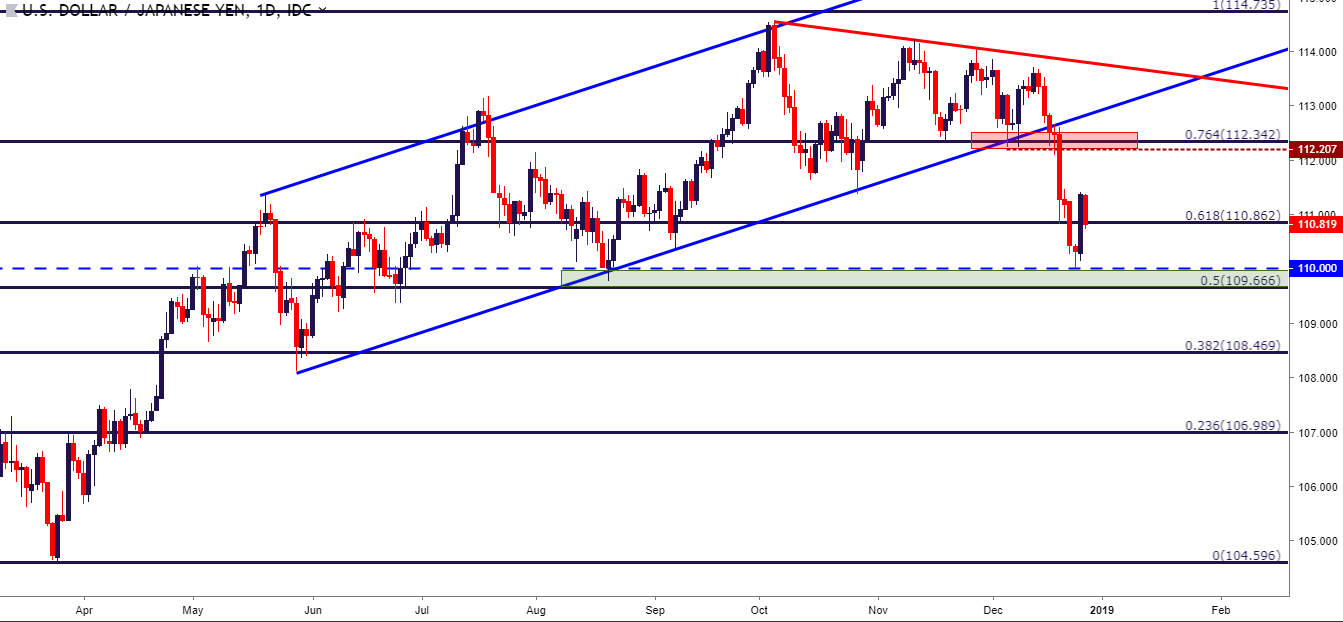
Chart prepared by James Stanley
EUR/JPY APPROACHES YEARLY LOW
Going along with two of the above themes, with the Euro showing stability while Yen-strength remains fairly-pronounced, EUR/JPY has made a fast approach at re-testing the 2018 low at a key level on the chart. The prices of 125.00 is confluent with the 38.2% Fibonacci retracement of the 2014-2016 sell-off at the price of 124.91; and this region has helped to produce two significant support bounces this year, first in May and again in August.
I listed this as my Top Trade for 2019, looking for the down-side of the pair to fill-in as risk aversion continues into the New Year.
EUR/JPY DAILY PRICE CHART
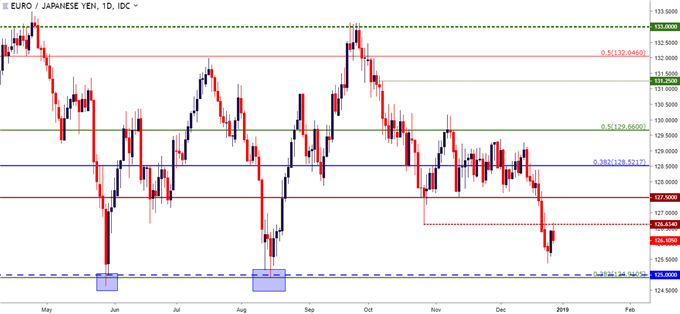
Chart prepared by James Stanley
Disclosure: Do you want to see how retail traders are currently trading the US Dollar? Check out our IG Client Sentiment ...
more

