
- The US Dollar falls slightly on expectations that the Fed will deliver a dovish guidance.
- Investors see the Fed acknowledging progress in inflation and growing risks to labor market strength.
- After the Fed policy, the US NFP report for July will be the key trigger for the US Dollar.
The US Dollar (USD) exhibits a subdued performance in Wednesday’s European session ahead of the monetary policy announcement by the Federal Reserve (Fed) at 18:00 GMT. The US Dollar Index (DXY), which tracks the Greenback’s value against six major currencies, edges lower to near 104.40. 10-year US Treasury yields remain flat near more than four-month low around 4.14% on expectations that the outcome of the Fed policy will not be favorable for the consistency of the restrictive interest rate framework.
Investors see the Fed leaving interest rates unchanged in the range of 5.25%-5.50% consecutively for the eighth meeting. However, the communication on the interest rate guidance is expected to be dovish due to cooling United States (US) inflationary pressures and moderating labor market strength.
Unicredit Research said in a note, The Fed will likely leave rates unchanged but send a clear signal that it's getting closer to cutting rates and could do so as soon as September.”
Daily digest market movers: US Dollar underperforms ahead of Fed policy
- The US Dollar underperforms its major peers, except the Australian Dollar (AUD), on Wednesday. The Greenback weakens on expectations that the Fed will turn dovish this time. Investors await the monetary policy statement and the Fed Chair Jerome Powell’s conference to know how soon and how much the central bank will reduce interest rates this year. The Aussie weakens after expected decline in annual Q2 Consumer Price index (CPI) print.
- According to the CME FedWatch tool, 30-day Federal Fund Futures pricing data shows that the central bank will reduce interest rates by 25 basis points (bps) from their current levels in the September meeting. The data also shows that there will be two rate cuts instead of one as projected by policymakers in the latest Fed dot plot.
- The expectations for the Fed to deliver dovish guidance have been prompted by downside risks to inflation remaining persistent and easing labor market strength. US CPI slowed more than expected in May and June, suggesting that the disinflation process has resumed, which reversed in the first quarter of the year. Meanwhile, moderating job demand and a more than two-year high Unemployment Rate have indicated that the labor market has ceased to be resilient.
- Before the Fed’s decision, the US ADP Employment Change for July will be under the spotlight. The report is estimated to show that private payrolls rose steadily by 150K.
- Volatility in the FX domain will last the entire week as the US ISM Manufacturing Purchasing Managers’ Index (PMI) and the Nonfarm Payrolls (NFP) for July are lined up for release, which will be published on Thursday and Friday, respectively.
- Meanwhile, the market sentiment remains firm despite deepening fears of widening Middle East conflict. The killing of Hamas leader Ismail Haniyeh in an Israeli air strike on Tehran has prompted risks of a potential escalation in the Israel-Iran war. Historically, geopolitical tensions turn investors risk-averse but investors have already priced in Middle East woes.
US Dollar Price Today:
US Dollar PRICE Today
The table below shows the percentage change of US Dollar (USD) against listed major currencies today. US Dollar was the strongest against the Australian Dollar.
| USD | EUR | GBP | JPY | CAD | AUD | NZD | CHF | |
|---|---|---|---|---|---|---|---|---|
| USD | -0.01% | 0.07% | -1.56% | -0.03% | 0.74% | -0.16% | -0.13% | |
| EUR | 0.01% | 0.10% | -1.48% | -0.02% | 0.74% | -0.13% | -0.12% | |
| GBP | -0.07% | -0.10% | -1.60% | -0.12% | 0.63% | -0.23% | -0.20% | |
| JPY | 1.56% | 1.48% | 1.60% | 1.58% | 2.29% | 1.38% | 1.46% | |
| CAD | 0.03% | 0.02% | 0.12% | -1.58% | 0.74% | -0.14% | -0.10% | |
| AUD | -0.74% | -0.74% | -0.63% | -2.29% | -0.74% | -0.87% | -0.85% | |
| NZD | 0.16% | 0.13% | 0.23% | -1.38% | 0.14% | 0.87% | 0.03% | |
| CHF | 0.13% | 0.12% | 0.20% | -1.46% | 0.10% | 0.85% | -0.03% |
The heat map shows percentage changes of major currencies against each other. The base currency is picked from the left column, while the quote currency is picked from the top row. For example, if you pick the US Dollar from the left column and move along the horizontal line to the Japanese Yen, the percentage change displayed in the box will represent USD (base)/JPY (quote).
Technical Analysis: US Dollar faces resistance near 50-day EMA
(Click on image to enlarge)
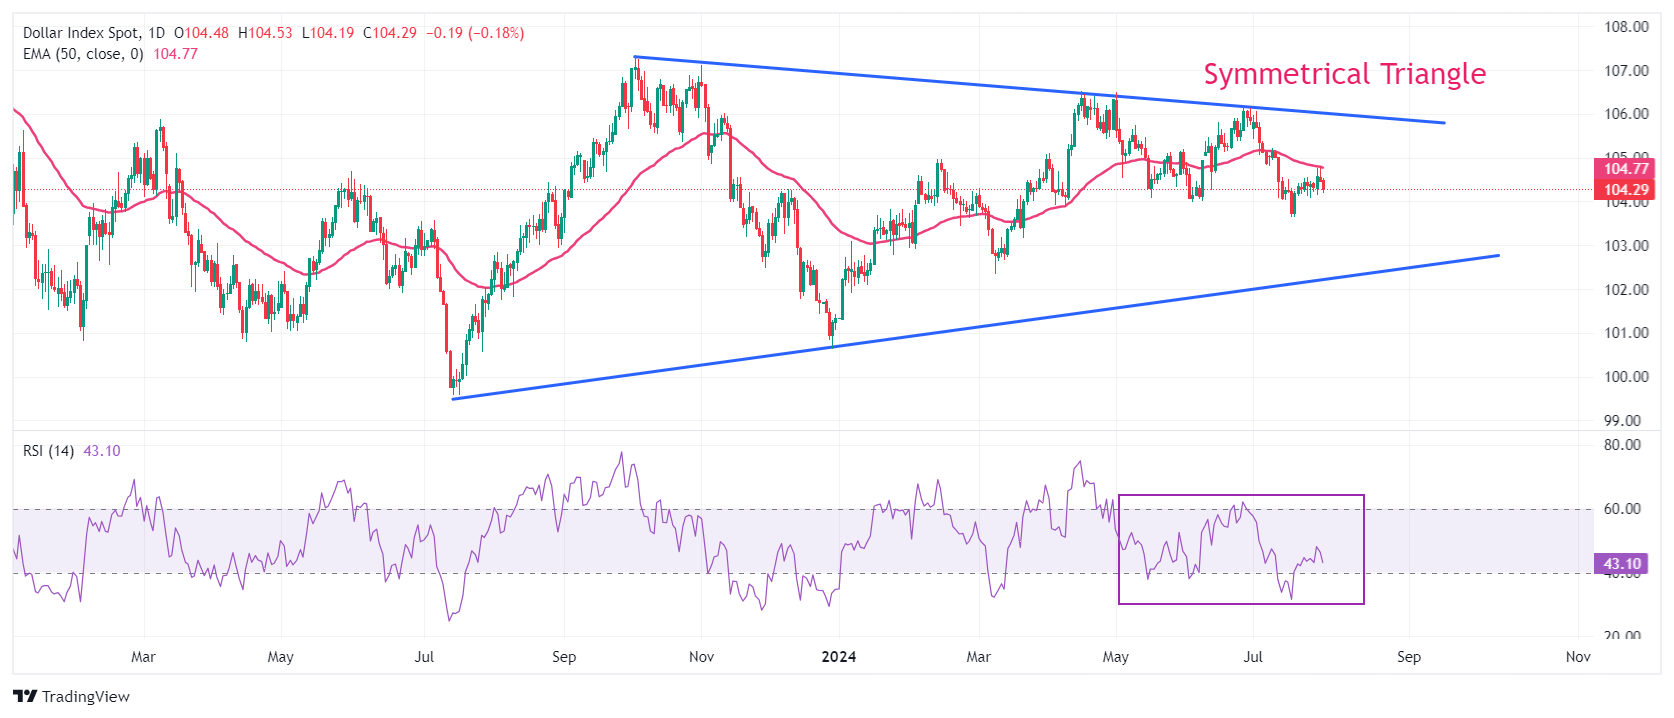
The USD Index trades in a Symmetrical Triangle formation, on a daily timeframe, which exhibits a sharp volatility contraction. The above-mentioned chart pattern results in a sideways trend with lower volume and smaller ticks. The near-term trend remains bearish as the 50-day Exponential Moving Average (EMA) around 104.77 is acting as major barricade for the US Dollar bulls.
The 14-day Relative Strength Index (RSI) oscillates in the 20.00-60.00 range, suggesting that the overall trend is bearish. While the bearish momentum is inactive.
On the upside, July 9 high at 105.20 and three-month high near 106.00 will be key resistances for the US Dollar. While July 17 low at 103.65 and March 8 low at 102.35 will be key support areas.
More By This Author:
Gold Price Gains On Middle East Tensions, Focus Is On Fed PolicySilver Price Forecast: XAG/USD gives up intraday gains after upbeat US JOLTS Job Openings
USD/CHF Price Analysis: Jumps To Near 0.8850 As US Dollar Advances


Comments
Log in or sign up to join the conversation.