
- The US Dollar edges lower on Monday after market sentiment improved as European leaders will to guarantee a peace deal in Ukraine.
- Traders will focus on key US manufacturing data on Monday with the ISM and S&P Global PMI release.
- The US Dollar Index (DXY) seems to be looking for nearby support after last week’s surge.
The US Dollar Index (DXY), which tracks the performance of the US Dollar (USD) against six major currencies, edges slightly lower and trades near 107.00 at the time of writing on Monday. Market mood improved after European leaders, including Ukrainian President Volodymyr Zelenskyy, showed a willingness to guarantee a peace deal in Ukraine on Sunday. The plan now needs to be backed by the United States (US).
On the economic data front, the focus will be on the manufacturing sector in the United States. In addition to the S&P Global Purchase Managers Index (PMI) final reading for February, the Institute for Supply Management (ISM) will release its specific manufacturing PMI report. Besides the headline gauge, the Prices Paid and New Orders components could give some insight into inflation and how order books look in the sector after just over a month of US President Trump’s influence.
Daily digest market movers: All about Manufacturing
- At 14:45 GMT, S&P Global releases its Manufacturing PMI final reading for February. Expectations are for a steady 51.6 from the preliminary reading.
- At 15:00 GMT, the ISM will release its report on the Manufacturing sector for February.
- The headline PMI is expected to come in at 50.5 compared to 50.9 in January.
- The Prices Paid subindex is expected to come in at 56.2, coming from 54.9 in January.
- The New Orders component does not have a forecast available and stood at 55.1 in the January reading.
- Equities are in a good mood and are mildly positive at the start of this week.
- The CME Fedwatch Tool projects a 25.4% chance that interest rates will remain at the current range of 4.25%-4.50% in June, with the rest showing a possible rate cut.
- The US 10-year yield trades around 4.25%, further down from last week’s high of 4.574%.
US Dollar Index Technical Analysis: Headlines are the new data
This week could not start with more uncertainty, with many moving parts and ties still loose since Friday’s burst out at the Oval Office. It becomes relatively clear that US data will be seen as being on auto-pilot, while geopolitics will be the main drivers going deeper into 2025. Traders will need to embrace the new regime where one headline could easily snap a nice continuum or trend in any asset, as well as for the US Dollar Index.
On the upside, the 55-day Simple Moving Average (SMA) is the first resistance to watch for any rejection, currently at 107.98. In case the DXY can break above the 108.00 round level, 108.50 is coming back in scope.
On the downside, the 107.00 round level needs to hold as support. Nearby, 106.84 (100-day SMA) and 106.52, as a pivotal level, should act as support and avoid any returns to the lower 106-region.
(Click on image to enlarge)
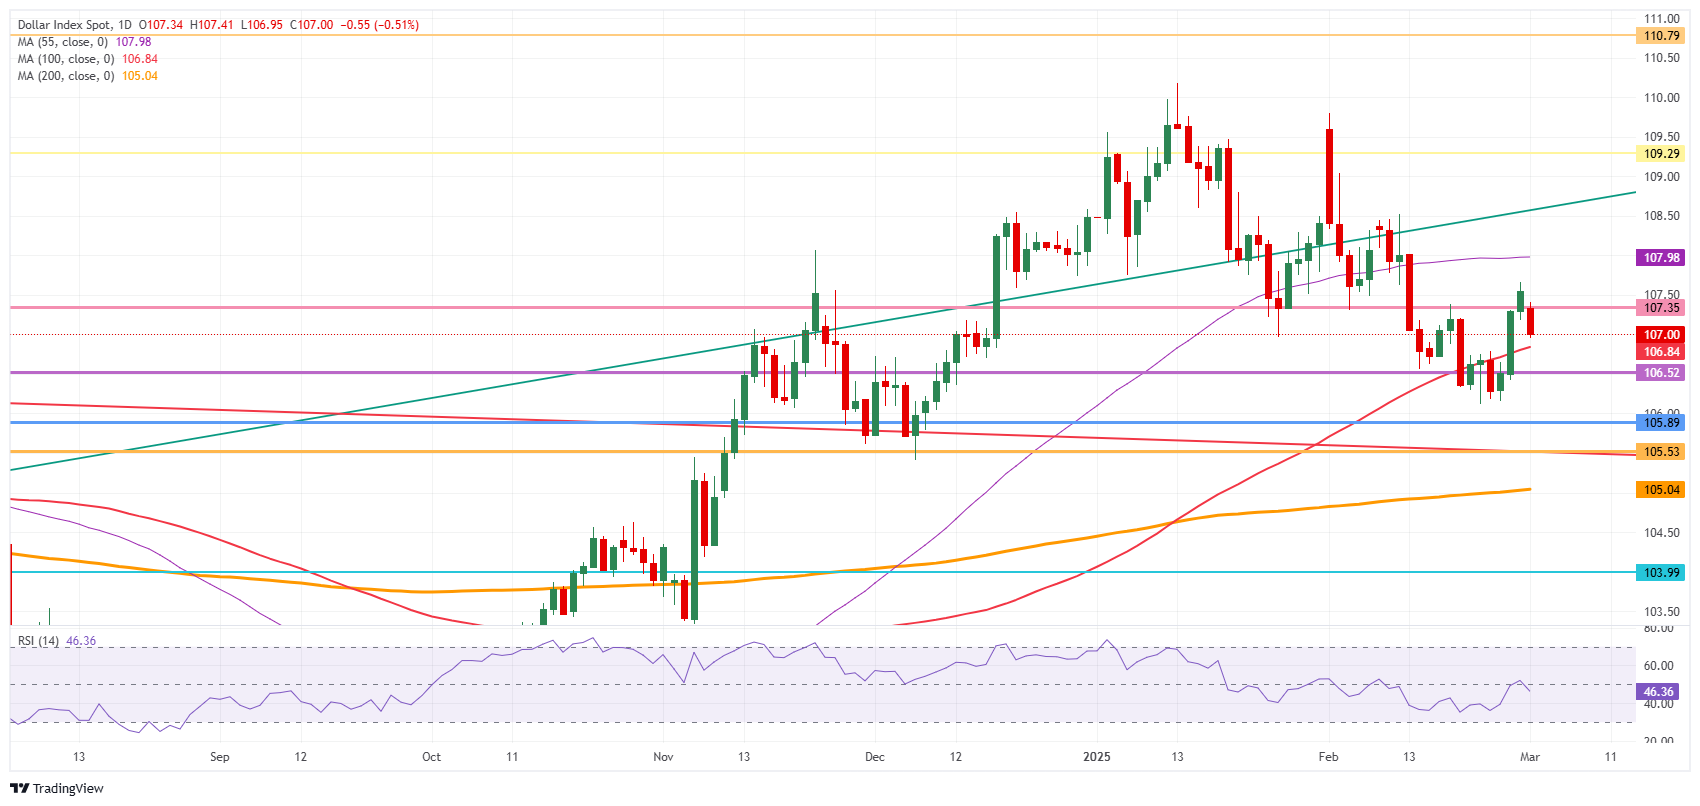
US Dollar Index: Daily Chart
More By This Author:
Gold Holds Steady Amid Tariffs, Fed Rate Cut Bets, Talks On Russia-Ukraine
US Dollar Holds Steady While President Zelenskyy Heads To The White House
Gold Faces A Near 3% Drop From Monday's All-Time High With Markets At Unease Over Tariffs
Comments
Log in or sign up to join the conversation.