
- The US Dollar consolidates Thursday's losses.
- Question grows in markets what President Donald Trump still can issue next on tariffs.
- The US Dollar Index (DXY) drops substantially below 108.00 and hovers around 107.00.
The US Dollar Index (DXY), which tracks the performance of the US Dollar (USD) against six major currencies, is orbiting around 107.00 at the time of writing, consolidating Thursday's losses. The Greenback came under pressure again after US President Donald Trump signed a memo on Thursday that instructed staff to work on reciprocal tariffs. These tariffs will take weeks or even months before being implemented, which gives time to US trading partners to negotiate and find solutions.
The economic calendar is focusing on US Retail Sales this Friday. Although US data tends to be market-moving, it seems markets are rather ignoring this week’s figures. Next week, investors will focus on the S&P Global Purchase Managers Index (PMI) preliminary data for February due on Friday 21.
Daily digest market movers: US Retail Sales ahead
- At 13:30, nearly all important data for this Friday will be released:
- January Import/Export prices are due, with the monthly Export Price Index expected to rise steadily by 0.3% and the Import Price Index to jump 0.4% compared to 0.1% in December.
- January Retail Sales will be published, with the headline figure expected to shrink by 0.1% compared to 0.4% growth in December. Retail Sales without Cars and Transportation should fall to 0.3% from 0.4% in the previous month.
- Equities are mixed due to all the geopolitical elements moving around. On average, most indices are down or up by less than 0.5%.
- The CME FedWatch tool shows a 57.4% chance that interest rates will remain unchanged at current levels in June. This suggests that the Fed would keep rates unchanged for longer to fight against persistent inflation.
- The US 10-year yield is trading around 4.54%, a deep dive from this week’s high of 4.657%.
US Dollar Index Technical Analysis: No pushback in sight
The US Dollar Index (DXY) is done for this week. A clear weekly loss is unavoidable, and the strong resistance at 107.35 is far away. From here, the DXY is technically handed over to the mercy of the moving averages and the Relative Strength Index (RSI), which is still bearing plenty of room for more downturn. The 200-day Simple Moving Average (SMA), trading around 104.93, might be the one to look out for.
On the upside, that previous support at 107.35 has now turned into a firm resistance. Further up, the 55-day SMA at 107.90 must be regained before reclaiming 108.00.
On the downside, look for 106.52 (April 16, 2024, high), 106.34 (100-day SMA), or even 105.89 (resistance in June 2024) as better support levels. Even though the RSI shows room for more downside, the 200-day SMA at 104.93 could be a possible outcome.
(Click on image to enlarge)
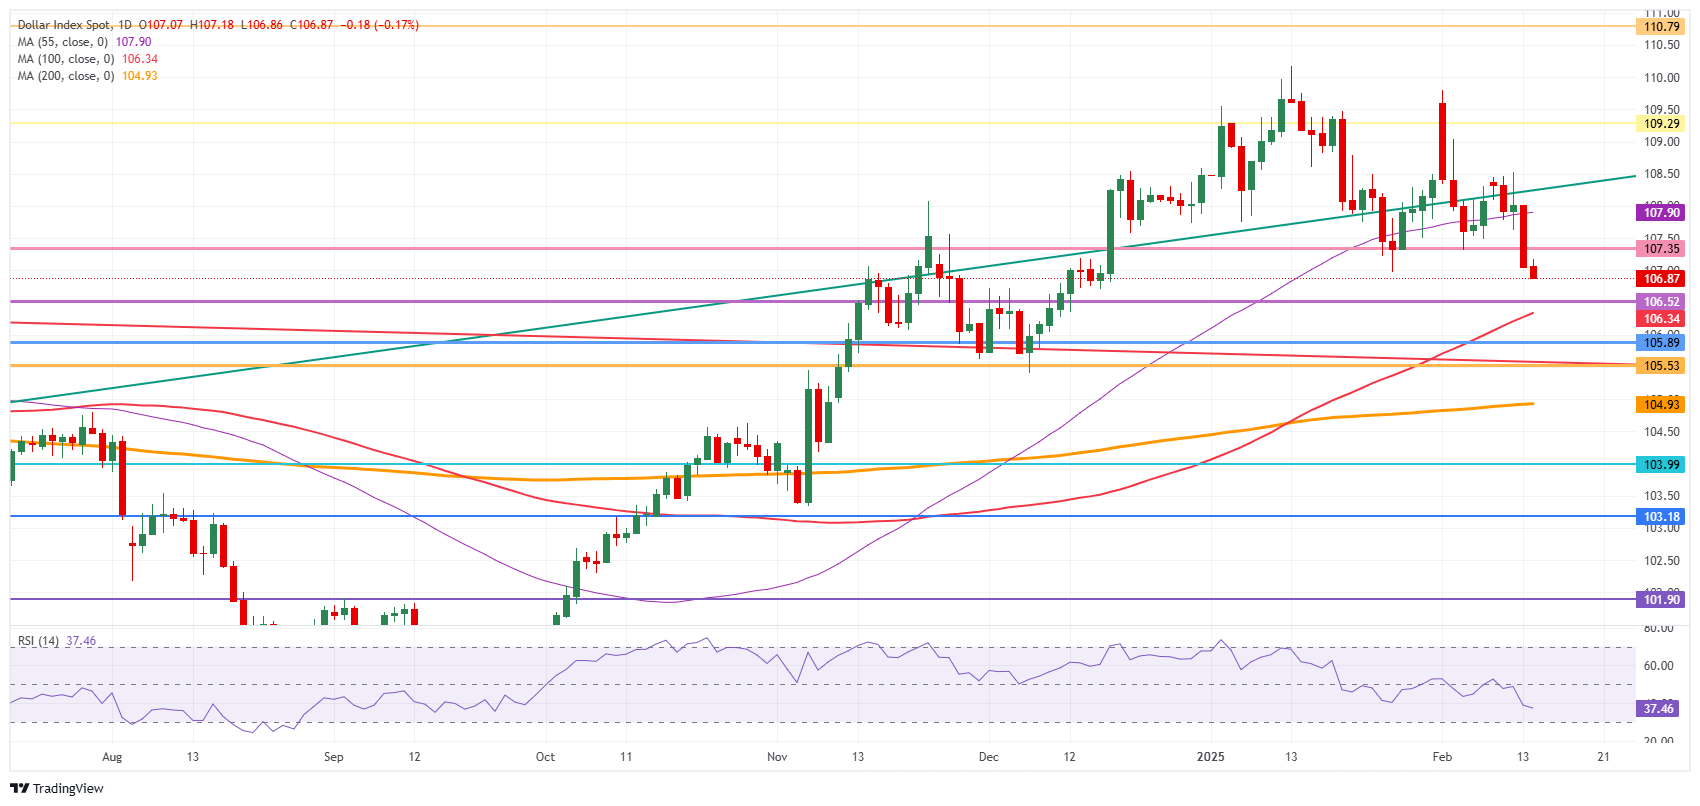
US Dollar Index: Daily Chart
More By This Author:
Gold On Its Way To Hit Another Fresh All-time HighUS Dollar Retreats With Possible Peace Talks Between Russia And Ukraine Fueling Risk-On Across Markets
Gold Picks Up Ascent Despite Risks Residing In The Background
Comments
Log in or sign up to join the conversation.