Around the start of each month, all the automated trading systems that are running for 3 months on the D1 for each pair are being refreshed with a new collection to run again for about 3 months. The automated trading systems are better known as Expert Advisors (EAs) used in MetaTrader. We will investigate the performance of the Expert Advisors (EAs) that are trading the D1 chart because there is interesting information. We will do this also by looking at the market development during this period. In the month of June, a profit of 9.68% was made with FxTopSystem, see the results by clicking here.
The markets
To investigate the markets and save time while still getting a good overall idea I use 2 charts. The risk benchmark S&P500 and the USDJPY measure risk aversion.
During the period of April 1 until June 30, the S&P500 was in a downtrend in the Daily chart. The result of the S&P500 during the period is a move down from 4546 to 3778. See the Daily S&P500 chart with the Ichimoku and MACD. There is bullish divergence in the MACD which can be a sign of bottoming.
(Click on image to enlarge)

In the Weekly S&P 500 chart, there are signs of bottoming too. The Stochastics is in an oversold area and making a second effort in a short time to recover. This will then be a technical correction within the current prevailing downtrend.
(Click on image to enlarge)

The risk-leaning markets like S&P500 were bearish but the USDJPY kept rising and this means often that there is no full Risk aversion (Risk-Off). Once Risk-Off takes the upper hand and the intensity of risk trends grows the USD, being a safe haven currency, can drop against the JPY.
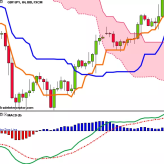
In the USDJPY Weekly chart here below there are some signs that it may drop because of being overbought. This means a technical correction and it does not have to go together with full Risk aversion.
- The last 3 candlesticks in the chart, a hanging man followed by 2 doji's are unconvincing and show doubt in the market.
- Price is far from the Tenkan-Sen and especially the Kijun-Sen. Depending on the strength of the technical correction it may go towards these levels. A correction towards the Tenkan-Sen seems obvious because that is the first level where resistance turned Support.
- The stochastics for measuring the overbought condition is showing that a correction is about to take place.
(Click on image to enlarge)

The pairs traded
We will look back for a period of 3 months. The pairs used during that period were the AUDCHF, AUDJPY, EURAUD, EURNZD, GBPJPY, NZDJPY, NZDUSD, and USDJPY.
The currency pairs with EAs used in the Daily chart being traded against the JPY were: AUDJPY, GBPJPY, NZDJPY, and USDJPY. We can check how strong Risk-ON was during that period by checking the total number of trades per direction for these pairs.
Here below you can see the total number of trades per direction. The blue circle shows that only long positions were taken, a total of 26. The chart shows the total results in pips of all the JPY pairs together. It is clear to see that going long against the JPY was the favorite direction, meaning that risk appetite (Risk-On) was still in favor instead of risk aversion (Risk-Off).
(Click on image to enlarge)

When looking at the total profits made it is clear to see that the GBPJPY and USDJPY had a very good performance. After that, we can see that NZDJPY also has a profit, but the AUDJPY lost.
The non-JPY pairs show:
- EUR against the commodity currencies AUD and NZD. The EUR is taking long positions but not (yet) succeeding in making a profit.
- AUD pairs making loss. The AUD is taking long positions against the CHF and JPY but failing to make a profit.
- NZDUSD making a profit. The USD is one of the strongest currencies during this period.

Conclusion
The Commodity currency AUD and to a lesser extent the NZD is showing some weakness. When looking at the AUD charts it is losing and being on the wrong side of the Ichimoku cloud and MACD. Only against the JPY it is still on the right side of the Ichimoku cloud and has a good MACD. However, it is close to a turning point with Price getting closer to the Ichimoku cloud and the MACD going towards 0. See the AUDJPY Daily chart.
(Click on image to enlarge)

The way it seems that Commodities are losing strength, but it is not accompanied by a strong trend. That makes the EAs fail when the EUR takes long positions against the AUD and NZD.
Because of commodities losing strength the AUD fails also to make a profit on the taken long positions against the JPY and CHF.
In the chart below the percentage illustrated the number of trades.
- The JPY pairs are almost 70% of the trades.
- The AUDJPY and AUDCHF are about 12.5%.
- The EURNZD and NZDUSD are about 18%.
Based on the history average sum of trades and looking back for a period of 10 years we can check if the current amount of trades are similar.
We check the trades made during the 3 months period of forward testing. We do this then every month for a period of 10 years. This means we can get the average of 10 years x 12 months = 120 Forward testing results for each pair. These are the results of the approved Forward test trading because the total amount is significantly higher.
The conclusion is that for the JPY pairs traded in the strategy GBPJPY, NZDJPY, USDJPY except for the AUDJPY the sum of trades during the current period had a 90% higher amount of trades. The other pairs traded including the AUDJPY were around their historical average.
The EAs on the JPY pairs took use of the opportunity to step in the strong bullish trend.

For the next period (3 months), the following 5 pairs are enabled for trading in the Daily chart: EURNZD, GBPJPY, NZDJPY, NZDUSD, and USDJPY.


Comments
Log in or sign up to join the conversation.