

Image Source: Unsplash
Like other major currencies, the New Zealand dollar is under pressure from the strong US dollar. This development comes after the Federal Reserve's updated forecasts last week. Stock market expectations point to only one interest rate cut this year, most likely in December.
Earlier, some American monetary policymakers confirmed these expectations, calling them reasonable.
The New Zealand services sector experienced a significant downturn in May, dropping the indicator to its lowest value since 2007. This reflects the country's economic state, which is already in recession. The business activity index also decreased to 43.0 points from 46.6 points previously. Everything below the 50.0-point mark indicates a deterioration in the market situation.
Such data increases the likelihood that the Reserve Bank of New Zealand will decide to cut rates eventually. The main forecast is November. However, the RBNZ's position, which has been voiced repeatedly, is that in 2024, the rates are unlikely to be revised down. The Central Bank believes that any reduction is not likely before mid-2025.
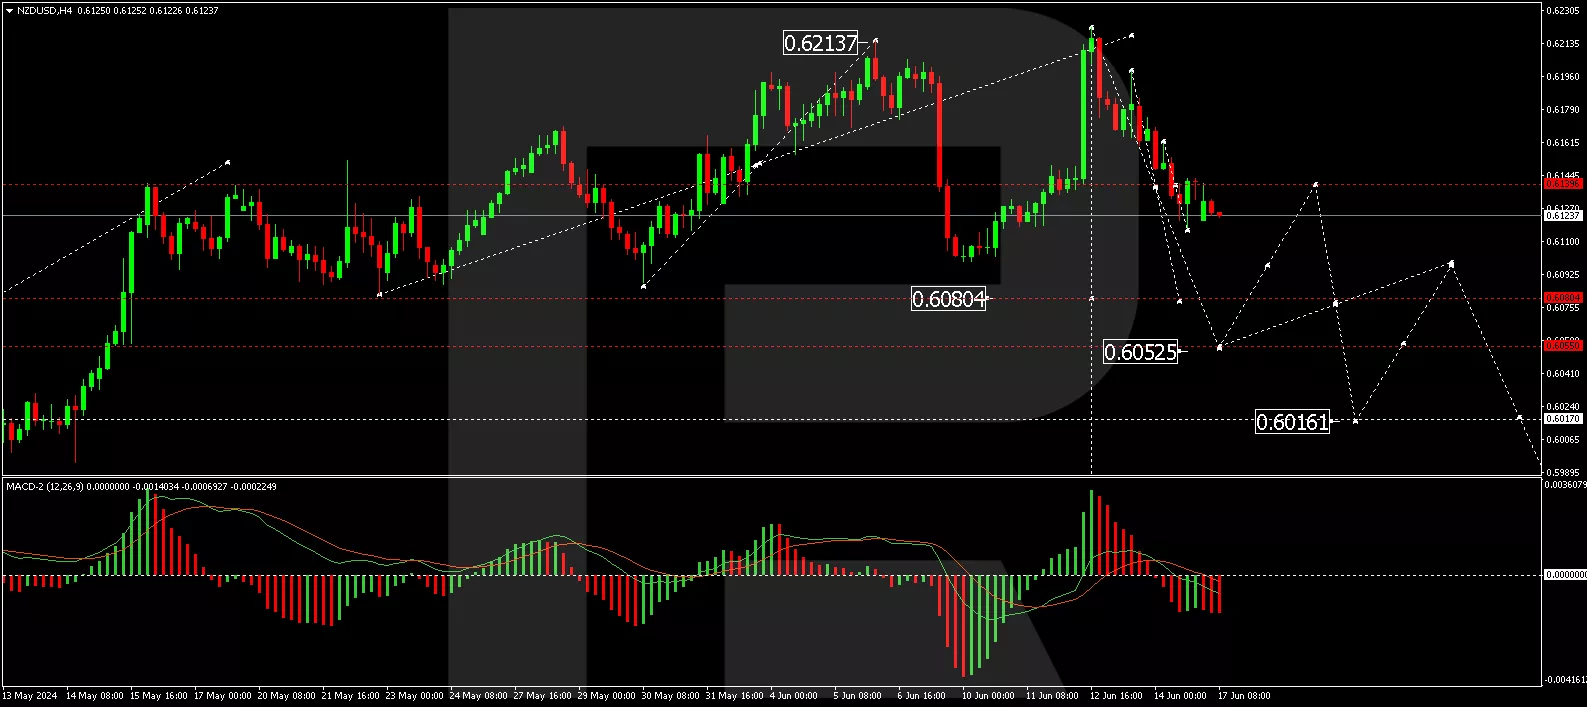
NZD/USD Technical Analysis
On the H4 NZD/USD chart, the market executed a correction wave to the level of 0.6220. At the moment, the market is forming another wave following the downward trend. The first target is at 0.6055. After reaching this level, a correction link to 0.6140 is possible (test from below). Next, we will consider a new wave of decline to 0.6016, the local target. Technically, this scenario is confirmed by the MACD indicator. Its signal line is located below the zero mark and is directed strictly downwards.
(Click on image to enlarge)
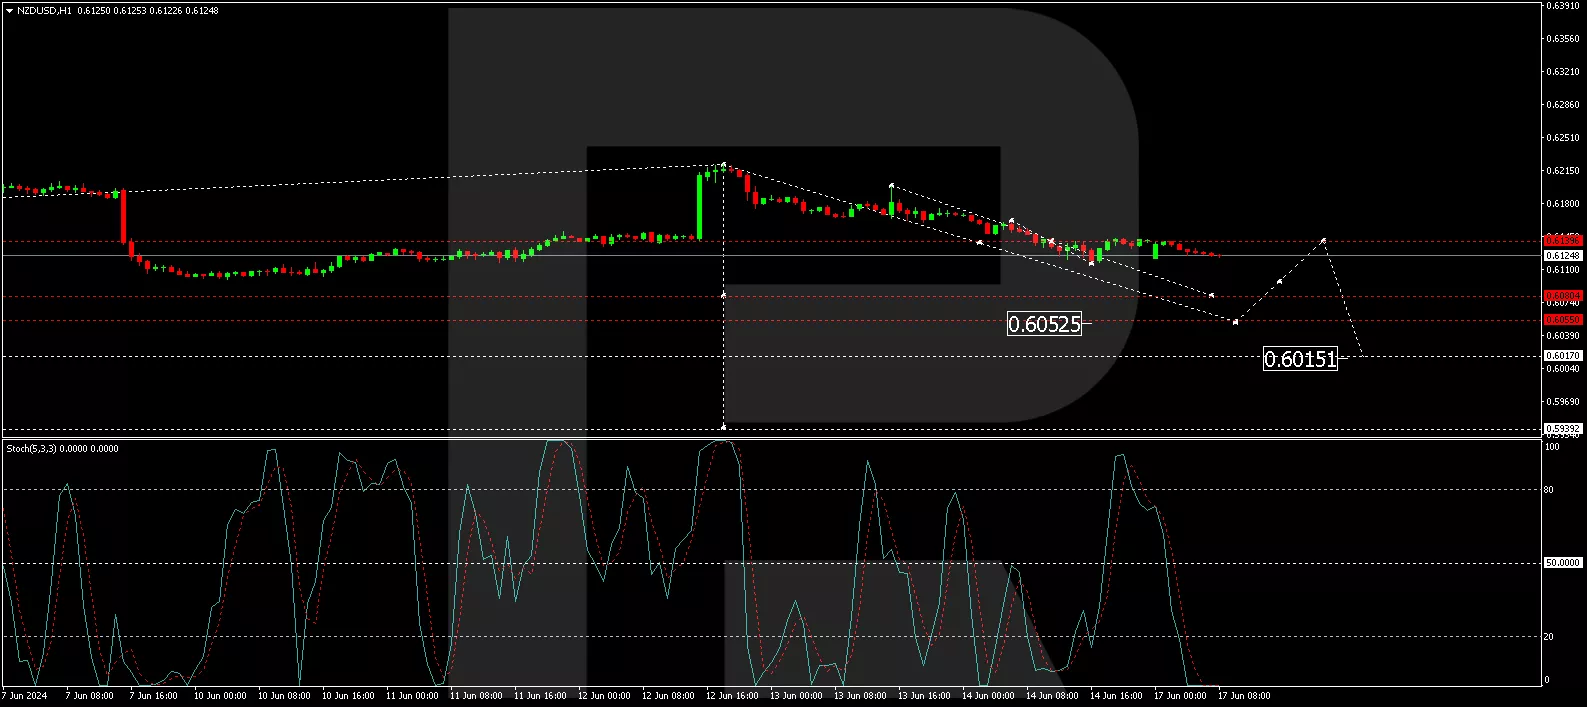
On the H1 NZD/USD chart, a downward impulse has been executed towards 0.6140. At the moment, a consolidation range has formed around this level. Today, we expect an exit from this range down to 0.6080. After reaching this level, a correction link to 0.6140 is possible (test from below), followed by a further decrease to 0.6055. The first target is trending down. Technically, this scenario is also confirmed by the Stochastic oscillator. Its signal line is located below the 20 mark and is directed strictly downwards.
(Click on image to enlarge)
More By This Author:
The Japanese Yen Fell To A Six-Week Low After The Bank Of Japan Ended Its Meeting
US Dollar Declines As Fed Signals Potential Rate Cut And Inflation Eases
Euro Hits Monthly Low Amid Political Instability In France


Comments
Log in or sign up to join the conversation.