
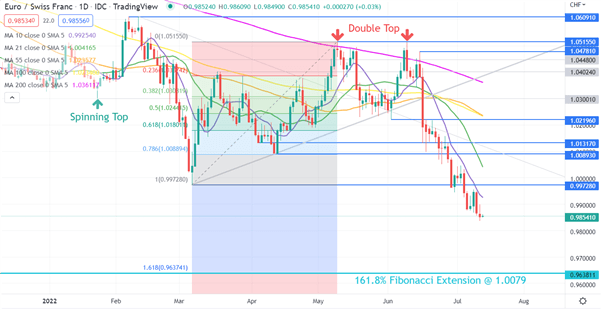
EUR/CHF and USD/CHF are put in Double Tops at the same time with highs in mid-May and mid-June in both currency pairs.
Since then, EUR/CHF has continued lower, but USD/CHF has found a base and might be charging back toward those peaks. The disparity in price action might be attributable to the differences in monetary policies of the relative central banks.
The Swiss National Bank (SNB) surprised markets with a 50-basis point hike last month. Keen observers of SNB President Thomas may have picked up some hints prior.
The SNB doesn’t mind keeping markets on their toes. It has a history of unconventional changes to the policy. They infamously abandoned the capping of the rising Franc in 2015 that saw EUR/CHF go from 1.2000 to 0.8600 in a matter of moments. It then recovered back above parity, where it has mostly been ever since.
The SNB meets quarterly to make decisions on monetary policy and its next gathering is in September. The central bank does have scope within its mandate to meet between meetings if conditions warrant it.
Later this month both the European Central Bank and the Federal Reserve will make their decisions on policy.
The Fed is expected to continue tightening while the ECB is widely anticipated to make the first step to reining in the loose policy. This might change the picture for EUR/CHF and USD/CHF disparity.
EUR/CHF Technical Analysis
EUR/CHF made a fresh 7-year low at 0.9836 last session after moving under prior lows and parity as the bearish momentum appears to have picked up steam.
After such a move, it is not surprising that all Simple Moving Averages (SMA) display a negative gradient. Additionally, the 55-day SMA has just crossed below the 100-day SMA to make a Death Cross. This might suggest further bearishness could unfold.
Support may lie at the 161.8% Fibonacci Extension at 0.9638.
(Click on image to enlarge)
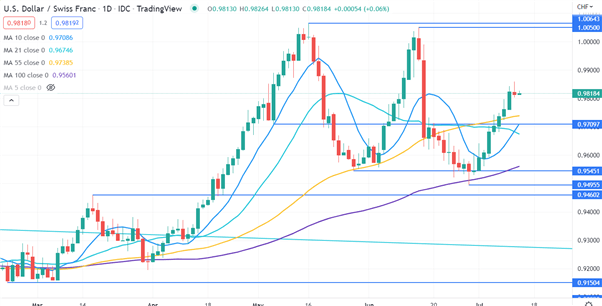
USD/CHF Technical Analysis
USD/CHF has bounced off last month’s low of 0.9495 and moved above several Simple Moving Averages (SMA) but they have positive and negative gradients. This may suggest a range-trading environment.
Support could be at the breakpoints of 0.9710, 0.9545, and 0.9460 or the low of 0.9495. On the topside, resistance might be at the twins' peaks of 1.0050 and 1.0064.
(Click on image to enlarge)
More By This Author:
S&P 500, Nasdaq 100 Forecast: U.S. Inflation Data May Fuel Volatility & Hammer Stocks
Bitcoin (BTC) Treads Cautiously Ahead of US CPI – USD Strength Holds
Euro Price Action Setups: EUR/USD, EUR/CHF, EUR/JPY


Comments
Log in or sign up to join the conversation.