S&P 500 Rallies To Six-Week-Highs, US Dollar Sinks To Support On FOMC

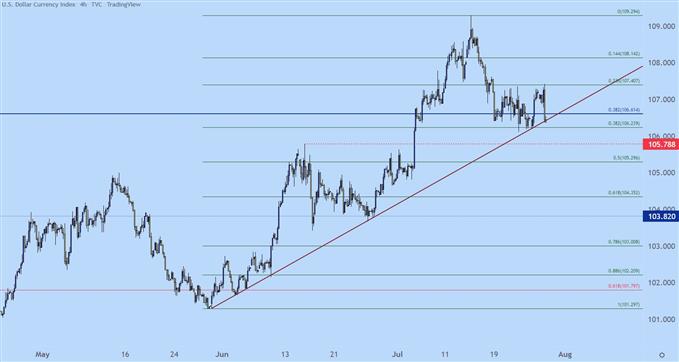
The Fed hiked rates by 75 basis points at the July rate decision and, at this point, markets have handled the news in a positive manner as the S&P 500 has jumped up to a fresh six-week-high. The US Dollar pulled back and as of this writing is finding support around the weekly lows in a confluent zone. There’s a Fibonacci level at 106.24 that’s helped to mark the lower-portion of that area along with a longer-term Fibonacci level at 106.62. A trendline is also in-play, which connects swing-lows form mid and late-June, the projection of which started to come into play last week. The grouping of wicks on the underside of candles in this area illustrates current support helping to hold the lows.
US DOLLAR FOUR-HOUR PRICE CHART

Chart prepared by James Stanley; USD, DXY on Tradingview
IF THE FED HIKED, WHY DID THE DOLLAR DROP?
There were building fears of a possible 100 basis point hike at this rate decision so the fact that it came in at 75 may have disappointed some of those exuberant rate hike bets. But, throughout the press conference, FOMC Chair Jerome Powell had a number of comments that could be read as supportive for risk, remarking that the slowdown in Q2 was notable and that job creation, while still robust has slowed. The more important component regarding future rate hikes is inflation and Powell has opined that wagers are moderating and that the employment cost index will be an important indicator.
Powell also pointed to PCE as an inflation gauge and something that the bank will be watching closely. He said at some point it will be appropriate to slow down rate hikes, and there just so happens to be a PCE release on the economic calendar for this Friday.
So, likely, we will see this theme remain centerstage for the next few days as tomorrow brings GDP and Friday brings PCE followed by the University of Michigan Consumer Sentiment.
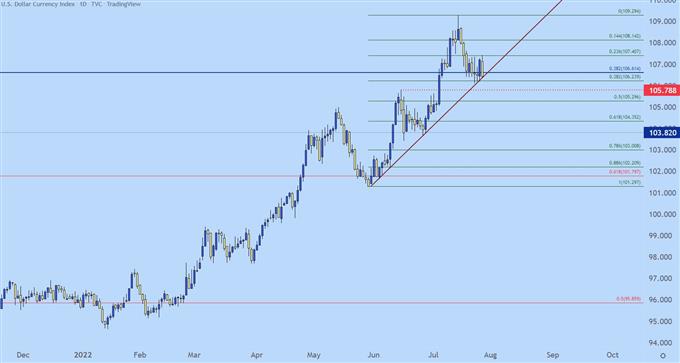
In USD, the Dollar remains perched near recently created 19-year-highs. The currency has been on its back foot for almost two weeks, however, and the bigger question as to whether bulls are able to drive USD or whether the currency pulls back to a deeper support level will likely have something to do with EUR/USD.
US DOLLAR DAILY PRICE CHART

Chart prepared by James Stanley; USD, DXY on Tradingview
S&P 500
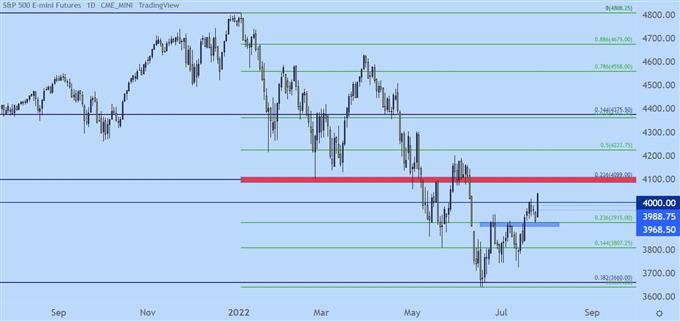
The S&P 500 has ran up to a fresh six-week-high on the back of this rate decision, and this extends the move from yesterday’s support test to over 100 points. That support test yesterday showed up at an interesting area, right at the 23.6% retracement of the 2022 sell-off, which had previously helped to set resistance.
This also exposes the next spot of possible resistance at the 38.2% retracement of that same Fibonacci study, which plots around another Fibonacci level of note at the 4100 level. That spot was also prior support in late-February, so this produces a bit of confluence for resistance potential.
S&P 500 DAILY PRICE CHART

Chart prepared by James Stanley; S&P 500 on Tradingview
More By This Author:
Rand Dollar News: USD/ZAR Falls Below 17.00 Ahead of Fed Decision Day
Coinbase Shares Slump As SEC Regulatory Noose Tightens
FTSE 100 Outlook: Nearing Key Pivot Ahead Of FOMC Decision
Disclosure: See the full disclosure for DailyFX here.


