S&P 500, Nasdaq, Dow Grind Into Key Support
Corporate earnings season is now in the rearview mirror and trading volume is picking up as the summer winds down, and investors are focusing on the state of the economy by assessing the day-to-day numbers on the Economic Calendar.
Today, the ISM Services PMI showed an expansion in the month of August supported by a pickup in new orders and business activity. The upbeat report suggests that despite tighter financial conditions, consumer demand remains strong, spurring optimism about the state of the economy as the service sector accounts for more than 75% of the GDP. In addition, the decline in prices paid appears to give the green light to the FOMC’s continued tightening cycle.
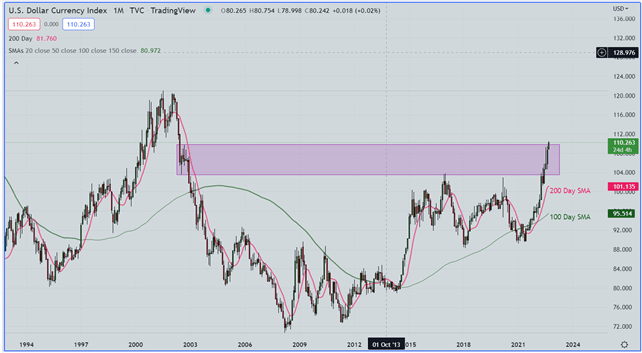
Therefore, in an environment where the labor market continues to be strong (confirmed by the August NFP numbers), consumption is robust, inflation is softening and financial conditions are tightening, US Treasury yields moved higher across the curve today. The 10-year rate jumped 11 basis points to 3.34% giving the US dollar index (DXY) some room to rise to fresh 20-year-highs.
USD INDEX (DXY) MONTHLY CHART

US Dollar Index (DXY) Monthly Chart Prepared Using TradingView
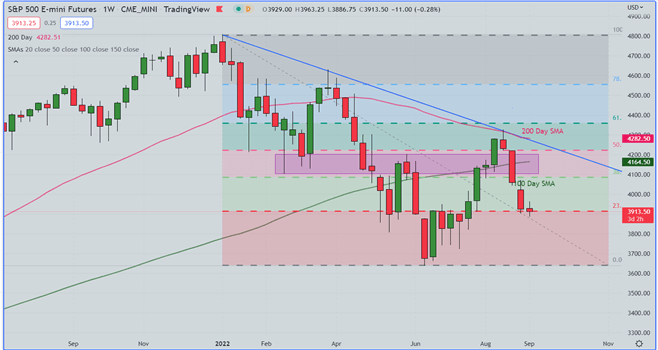
Meanwhile, risk assets struggled, and US equity indices were unable to hold early-session bids as prices fell back to key supports. The Dow fell 0.54% and the S&P 500 lost 0.40%. Both indices tested an important support zone as they hovered around the 23.6% Fibonacci retracement level of the 2022 sell-off.
S&P 500 (SPX) WEEKLY CHART

S&P 500 (SPX) Weekly Chart Prepared Using TradingView
On that note, almost all S&P sectors suffered setbacks today. Communication Services and Energy were the outliers that led the declines. Weighing on the energy sector were crude oil prices that continued to struggle as higher interest rates stoke fears that demand will eventually take a hit. Follow the link to Learn Crude Oil Trading Strategies and Tips.
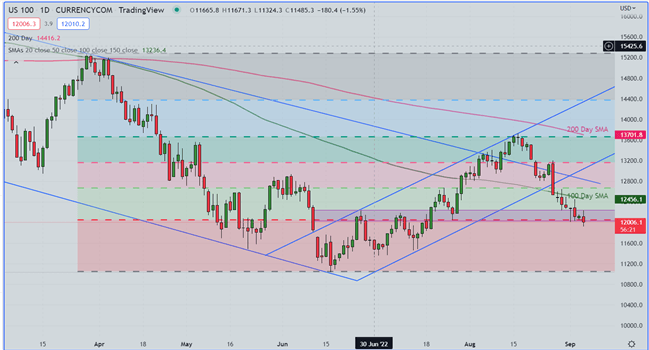
On the other hand, the Nasdaq100 posted a loss of 0.72% driven by the negative effects of rising interest rates on Growth Stocks. For the time being, the psychological level of 12,000, which sits around the 23.6% Fibonacci level, remains in place. A downward movement would open the door to further losses, with focus towards the June lows.
NASDAQ 100 DAILY CHART

Nasdaq 100 Daily Chart Prepared Using TradingView
Looking ahead for guidance, it is important to keep an eye on Fed Chairman Jerome Powell’s speech on Thursday, as the next FOMC monetary policy decision is scheduled for September 21st. Although the August CPI will be released next Tuesday, September 13th and this will be a widely-watched focal point that will give more information on the pace of inflationary pressures.
More By This Author:
Euro Forecast: EUR/USD Balance Of Risks Tilt Lower As King US Dollar Reigns Supreme
S&P 500, Nasdaq 100 Give Back Overnight Gains As US Traders Come Back Online
Pound Forecast: GBP Buoyed By New Prime Minister Optimism
Disclosure: See the full disclosure for DailyFX here.


