
Silver: Shrugging Off Attacks
There is a long list of arguments for why silver prices haven’t advanced further yet. Market manipulation is one of those arguments. While there is evidence that markets have always been manipulated, prices have eventually reached appropriate price levels regardless of manipulation.
Another recent argument is a news item claiming Bitcoin (BITCOMP) is to replace gold as an inflationary hedge tool, which in turn would have a substantial effect on silver. The market cap of all digital currencies is at around $3 trillion, and the market cap for gold is $11.7 trillion.
In a $615 trillion market cap world, gold and Bitcoin are a tiny niche. They can coexist with their relatively small size and their intrinsically different usefulness, primarily through performing various functions.
Weekly Chart, Silver in US Dollars - Strong Along Gold
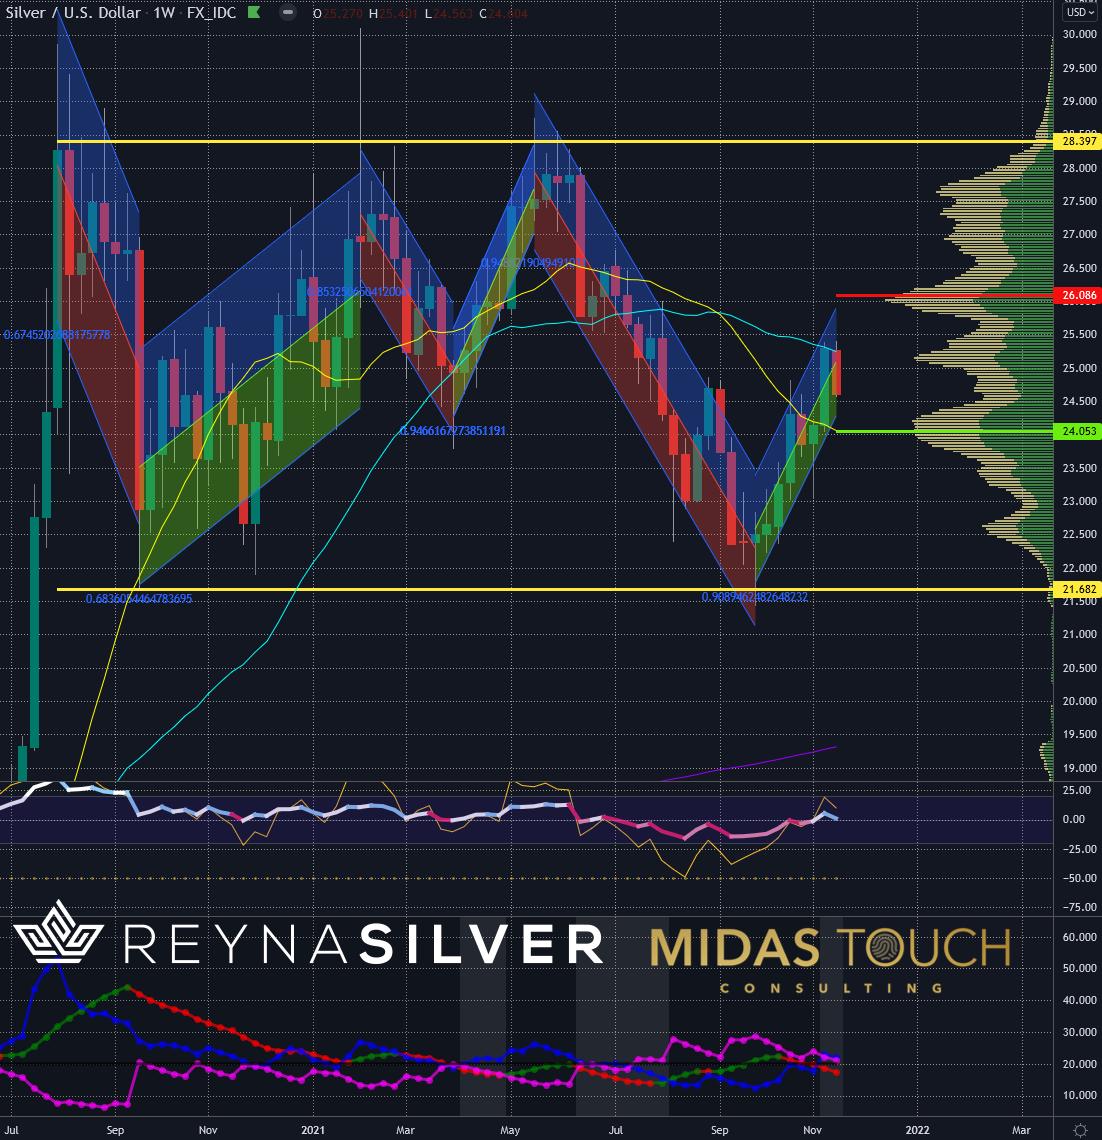
Silver in US dollars, weekly chart as of Nov. 20, 2021.
The weekly chart illustrates the price behavior over the last 15 months. Silver prices are trading near the center of the sideways range.
Gold in US Dollars, Weekly Chart - Rumors Shrugged Off
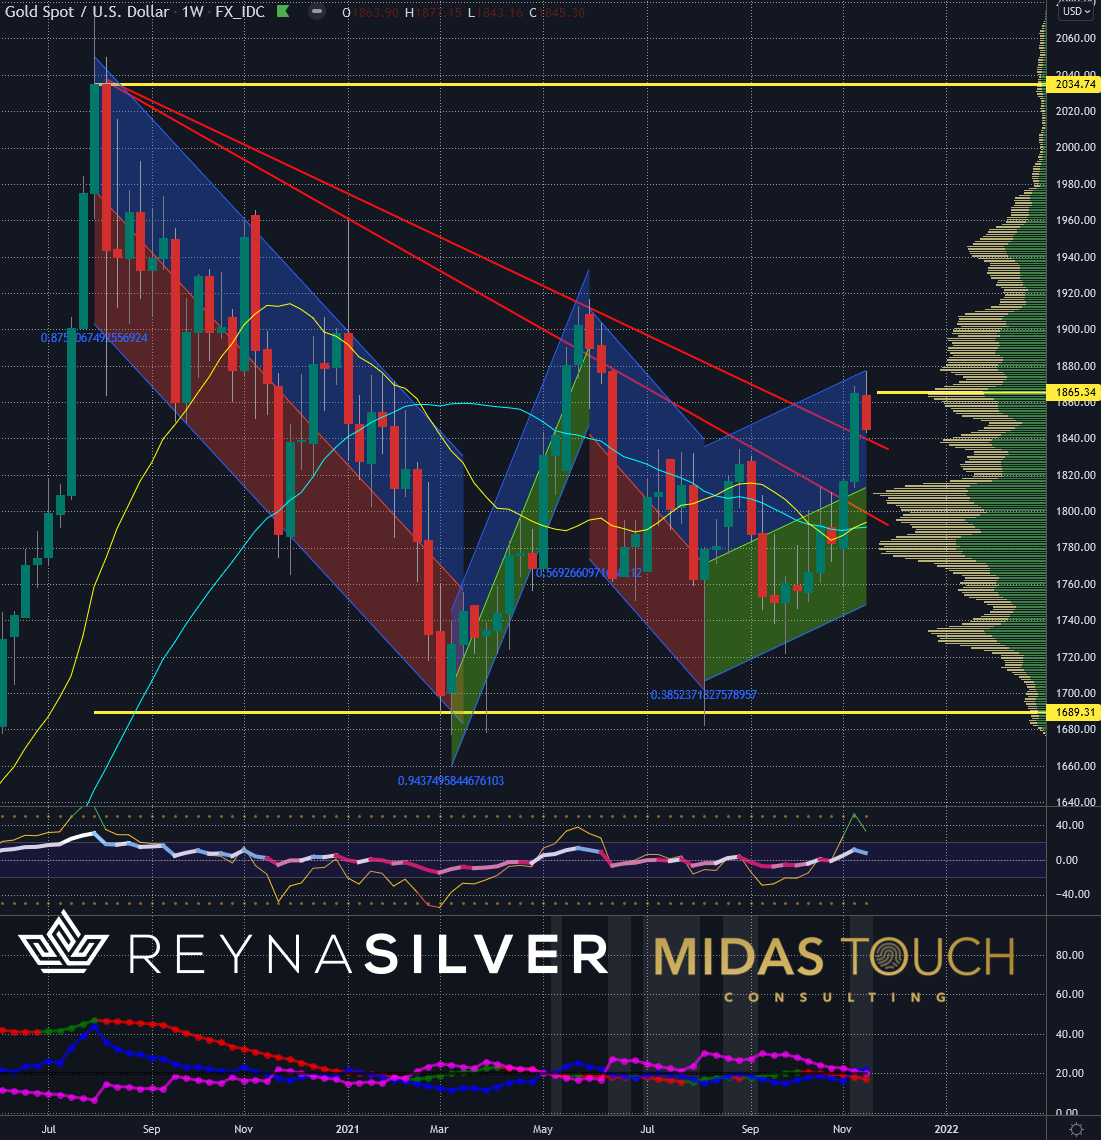
Gold in US dollars, weekly chart as of Nov. 20, 2021.
The weekly chart of gold isn’t much different from where prices stand. In short, there is no evidence that gold has lost its luster. Otherwise, we would see silver trading much lower due to the relationship between the metals. Rumors are just that – rumors. Silver is shrugging them off.
Silver in US Dollars, Quarterly Chart - Room to Go
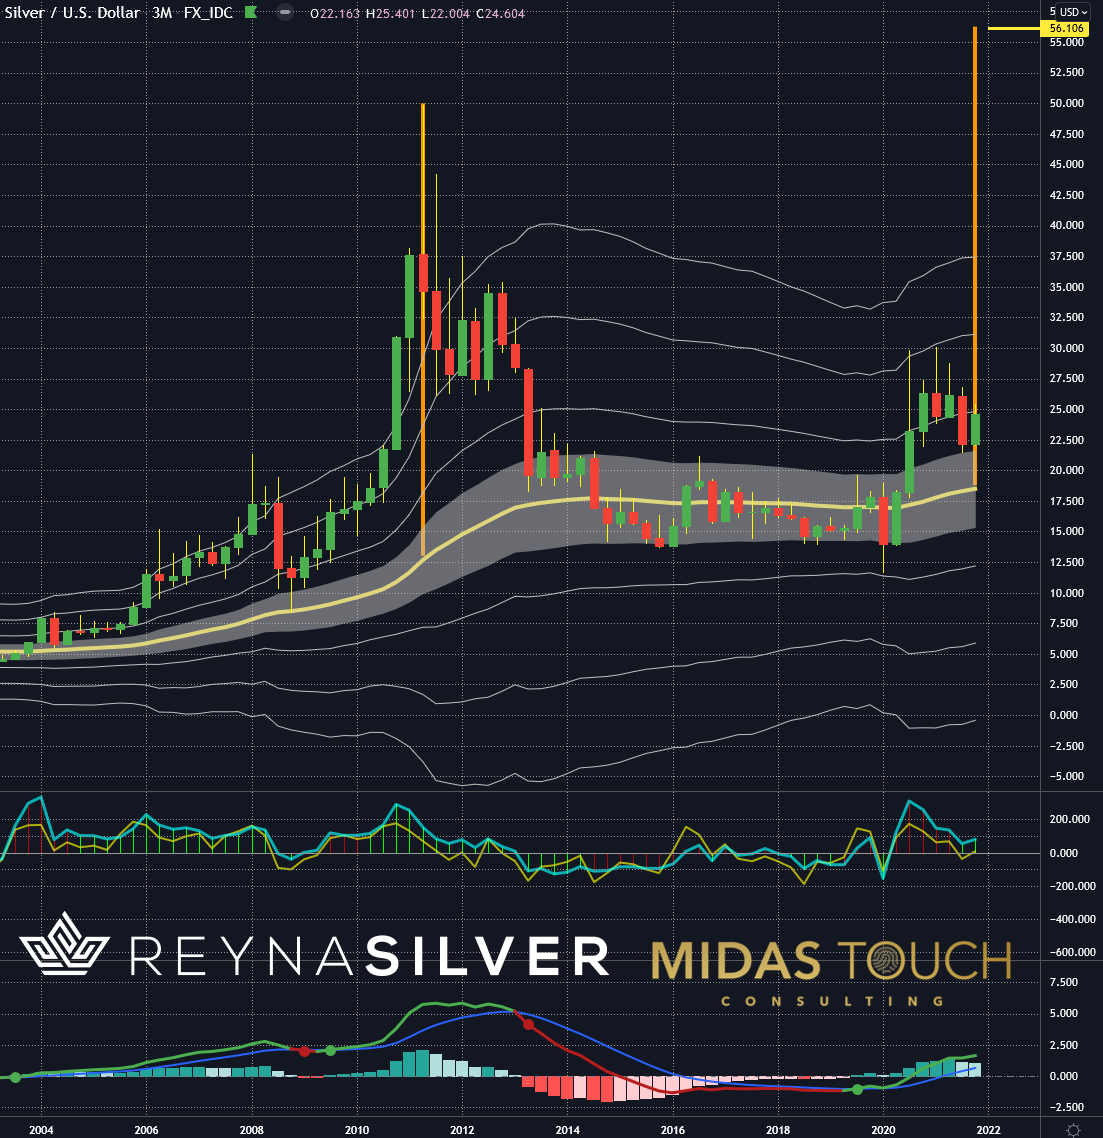
Silver in US dollars, quarterly chart as of Nov. 20, 2021.
A historical review with a quarterly chart over the last eighteen years reveals that silver prices can sustain extreme extensions from the mean (yellow line) for extended periods. Using the extreme of the second quarter in 2011 as a projective measurement (orange vertical line) for an upcoming target would provide for a price target more than 10% above all-time highs at $56.
In addition, the chart shows that we find ourselves in a strong quarter so far, which is in alignment with cyclical probabilities.
Silver in US Dollars, Weekly Chart - Prepping the Play
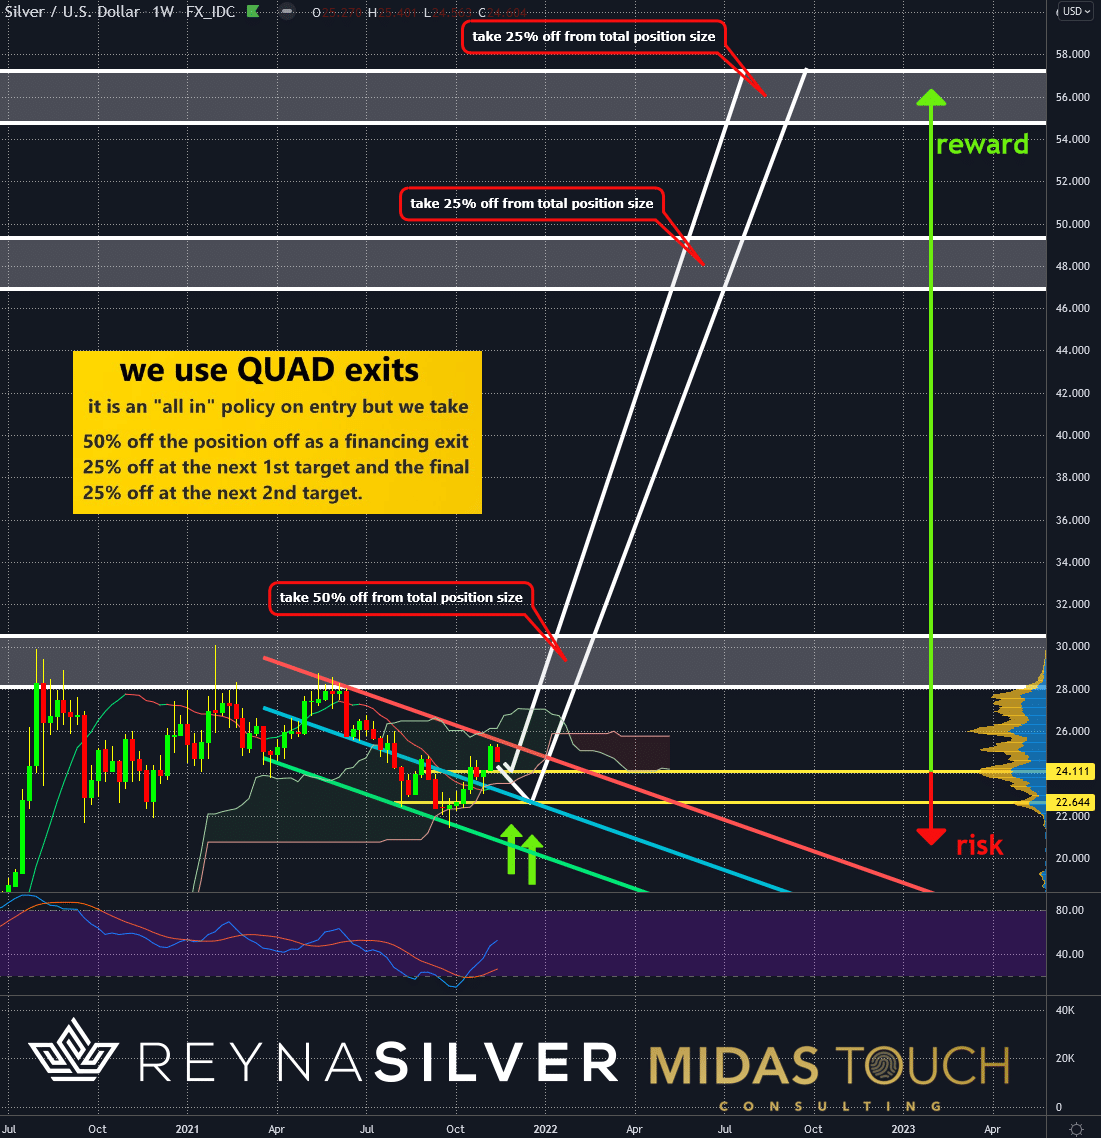
Silver in US dollars, weekly chart as of Nov. 20, 2021 - Trade setup
Let us return to the weekly time frame for a possible low-risk entry scenario with this target in mind. We find a supply zone based on fractal transactional volume analysis near the price levels of $24.11 and $22.65. Both of these levels are attractive entry zones for excellent risk/reward-ratio plays.
Silver: Shrugging Off Attacks - Conclusion
It will not be rumors, doubts, or speculations that serve as the catalyst for silver's success or failure. It isn’t a question of “if,” but just a question of “when” we will see the next massive price advance in this precious metal.
Disclaimer: This article does not contain investment advice or recommendations. Every investment and trading move involves risk, and readers should conduct their own research when making a ...
more

