
- NZD/USD finds a cushion near 0.5880, while the overall outlook remains bearish.
- Investors await the US core PCE inflation for June for fresh guidance on Fed interest rates.
- The New Zealand Dollar weakens due to multiple headwinds.
The NZD/USD pair finds temporary support near an almost three-month low of 0.5880 in Friday’s European session after a six-day losing spell. The Kiwi asset gains an ad-hoc ground as the US Dollar (USD) edges lower ahead of the United States (US) core Personal Consumption Expenditure price index (PCE) data for June, which will be published at 12:30 GMT.
The underlying inflation will influence market expectations for Federal Reserve (Fed) rate cuts this year. According to the CME FedWatch tool, traders remain confident that the central bank will start reducing interest rates from the September meeting.
Economists expect that the annual core PCE Price Index grew at a slower pace of 2.5% from May’s reading of 2.6%, with monthly inflation rising steadily by 0.1%.
Meanwhile, the New Zealand Dollar (NZD) has faced significant selling pressure this week due to China’s dismal economic prospects and rising expectations of rate cuts by the Reserve Bank of New Zealand (RBNZ) this year.
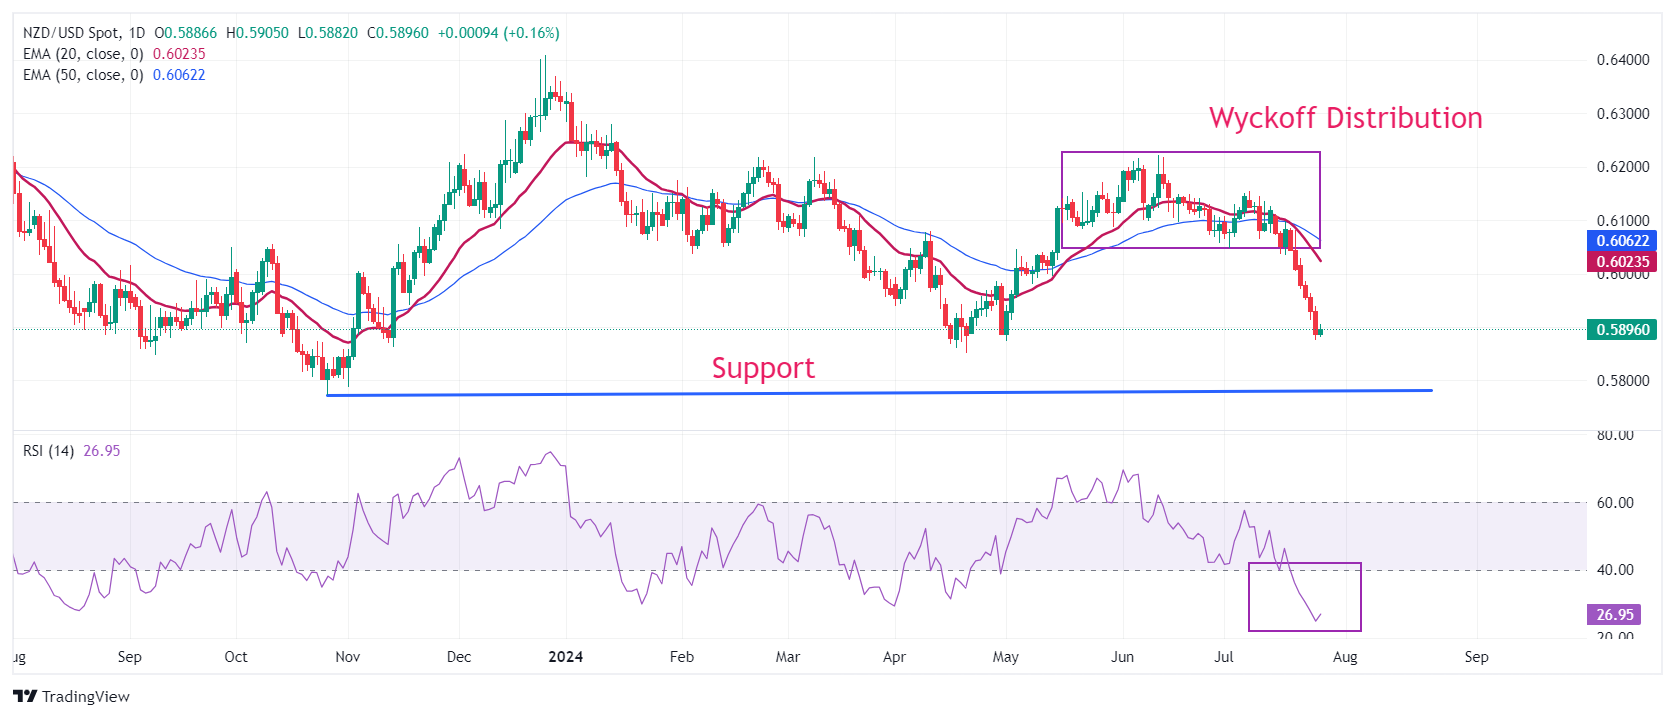
NZD/USD weakened after a breakdown of the Wyckoff Distribution formation on a daily timeframe. The Wyckoff Distribution exhibits the transfer of inventory from institutional investors to retail participants. The asset may find support near the trendline around 0.5900, plotted from 26 October 2023 low at 0.5770.
A bear cross, represented by 20- and 50-day Exponential Moving Averages (EMAs) near 0.6090 suggests that the overall trend is bearish.
The 14-day Relative Strength Index (RSI) shifts into the bearish range of 20.00-40.00, suggesting that a bearish momentum is intact.
More downside would appear if the asset breaks below April 19 low around 0.5850. This would drag the asset towards the round-level support of 0.5800, followed by 26 October 2023 low at 0.5770.
In an alternate scenario, a recovery move above the psychological resistance of 0.6000 would shift the trend towards the upside. This would push the asset higher to May 3 high at 0.6046 and July 17 high near 0.6100.
NZD/USD daily chart
(Click on image to enlarge)
More By This Author:
EUR/USD Trades Sideways In Countdown To US Core PCE InflationUSD/CAD Posts Fresh Eight-Month High Near 1.3850 After Robust US GDP Growth
NZD/USD Slides Further To Near 0.5900 As RBNZ Rate-Cut Bets Surge


Comments
Log in or sign up to join the conversation.