
- NZD/USD refreshes monthly low near 0.6076 as the Fed’s hawkish remarks strengthen the US Dollar’s appeal.
- Fed Bowman sees interest rates remaining steady for the entire year.
- A Double Top breakdown weakens the New Zealand Dollar.
The NZD/USD pair posts a fresh monthly low near 0.6076 in Wednesday’s New York session. The Kiwi asset faces intense selling pressure after breaking below the crucial support of 0.6100. The pair weakens as the US Dollar (USD) strengthens due to the Federal Reserve’s (Fed) hawkish remarks on the interest rate outlook.
Fed officials advocate for maintaining interest rates steady until they get evidence that inflation will return to the desired rate of 2%. On Tuesday, Fed Governor Michelle Bowman pushed hopes for rate cuts to next year and warned of further policy tightening if the disinflation process stalls or reverses.
Meanwhile, the CME FedWatch tool shows that traders see the central bank choosing the September meeting as the earliest point to start unwinding the restrictive policy framework.
On the Kiwi front, the Reserve Bank of New Zealand (RBNZ) is expected to keep its Official Cash Rate (OCR) steady at 5.5% for the entire year. The NZ inflation has been declining consistently from last five quarters but is still double the required rate of 2%.
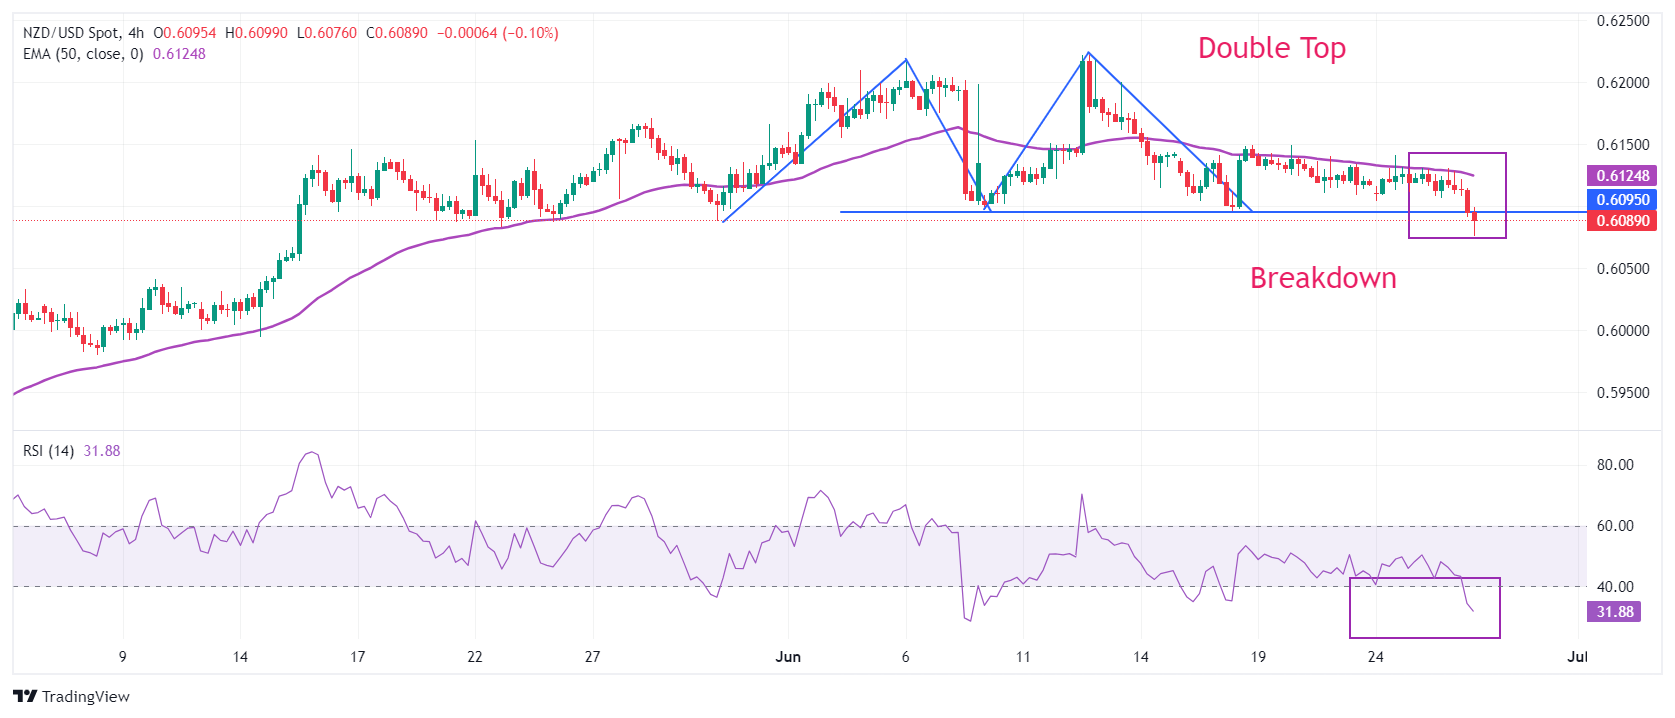
NZD/USD delivers a breakdown of the Double Top chart pattern formed in a four-hour timeframe. The breakdown of the above-mentioned chart pattern triggered after a downside move below the swing low plotted from June 10 low near 0.6100, which results in a bearish reversal.
The 50-period Exponential Moving Average (EMA) near 0.6125 continues to act as a major barricade for the New Zealand Dollar bulls.
The 14-period Relative Strength Index (RSI) falls below 40.00. Should the bearish momentum trigger the oscillator established below the same?
Investors would use a pullback move to near 0.6100 as a selling opportunity for targets near April 4 high around 0.6050 and the psychological support of 0.6000.
On the contrary, a reversal move above June 12 high of 0.6222, which will expose the asset January 15 high near 0.6250, followed by January 12 high near 0.6280.
NZD/USD four-hour chart
(Click on image to enlarge)
More By This Author:
AUD/USD Hits Resistance Near 0.6690 After Rally Inspired By Hot Aussie InflationSilver Price Forecast: XAG/USD Declines Below $29.40 As US Dollar Rebounds
USD/JPY Price Analysis: Shies From 160.00 As Japan’s Intervention Fears Intensify


Comments
Log in or sign up to join the conversation.