
Silver Price Forecast: XAG/USD Declines Below $29.40 As US Dollar Rebounds
Silver price (XAG/USD) slumps below lower end of Monday’s trading range near $29.40 in Tuesday’s New York session. The white metal faces selling pressure as the US Dollar (USD) has bounced back strongly after correcting on Monday. The US Dollar Index (DXY), which tracks the Greenback’s value against six major currencies, rebounds from 105.40.
The US Dollar recovers as investors become doubtful over the Federal Reserve’s (Fed) interest rate outlook. Currently, financial markets expect that the Fed will start reducing interest rates from the September meeting and subsequent rate cuts will be announced in the November or December meeting.
However, Fed policymakers argue in favor of maintaining interest rates at their current levels until they see inflation declining for months. In Tuesday’s New York session, Fed Governor Michelle Bowman said in an interview that she doesn't see any rate cut this year. Bowman added that rate cuts at this point are inappropriate, and the option of more rate hikes remains on the table if progress in the disinflation process appears to stall or reverse in the future.
Going forward, investors will focus on the United States (US) core Personal Consumption Expenditure Price Index (PCE) for May, which will be published on Friday. The core PCE price index data is the Fed’s preferred inflation measure, and it will provide fresh cues on when and how much the central bank will reduce interest rates this year.
Silver technical analysis
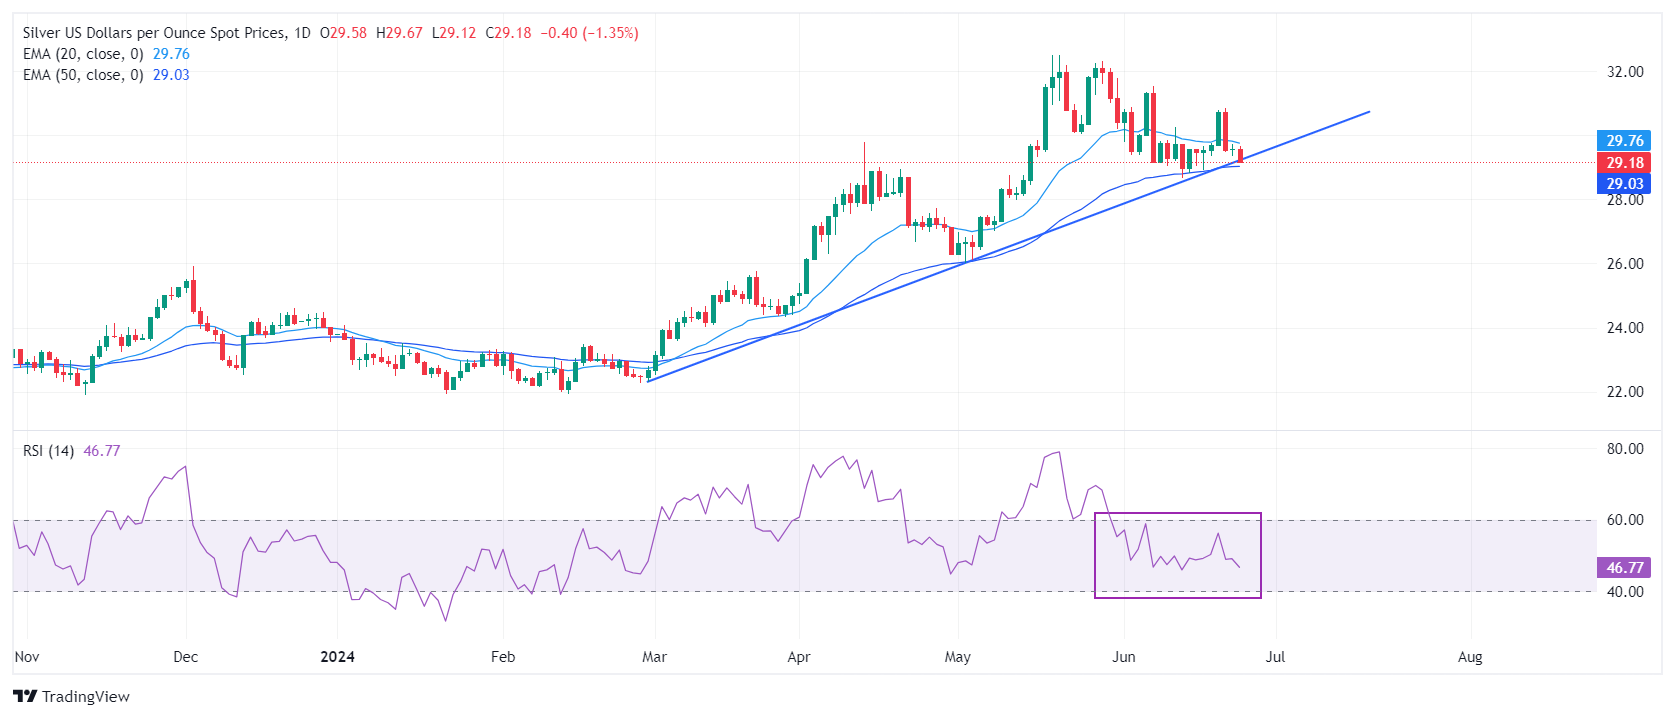
Silver price declines to near upward-sloping trendline plotted from February 29 low at $22.30 plotted on a daily timeframe. The asset corrects to near 50-day Exponential Moving Average (EMA) around $29.00. Sideways 20- and 50-day Exponential Moving Averages (EMAs) indicate a consolidation ahead.
The 14-day Relative Strength Index (RSI) oscillates in the 40.00-60.00 range, suggesting indecisiveness among investors.
Silver daily chart
(Click on image to enlarge)
XAG/USD
| OVERVIEW | |
|---|---|
| Today last price | 29.14 |
| Today Daily Change | -0.44 |
| Today Daily Change % | -1.49 |
| Today daily open | 29.58 |
| TRENDS | |
|---|---|
| Daily SMA20 | 30.11 |
| Daily SMA50 | 29.16 |
| Daily SMA100 | 26.81 |
| Daily SMA200 | 24.98 |
| LEVELS | |
|---|---|
| Previous Daily High | 29.73 |
| Previous Daily Low | 29.35 |
| Previous Weekly High | 30.86 |
| Previous Weekly Low | 28.93 |
| Previous Monthly High | 32.51 |
| Previous Monthly Low | 26.02 |
| Daily Fibonacci 38.2% | 29.58 |
| Daily Fibonacci 61.8% | 29.49 |
| Daily Pivot Point S1 | 29.38 |
| Daily Pivot Point S2 | 29.17 |
| Daily Pivot Point S3 | 29 |
| Daily Pivot Point R1 | 29.75 |
| Daily Pivot Point R2 | 29.93 |
| Daily Pivot Point R3 | 30.13 |
More By This Author:
USD/JPY Price Analysis: Shies From 160.00 As Japan’s Intervention Fears IntensifyEUR/USD Gains Firm Footing Above 1.0700 Amid Cheerful Market Mood
NZD/USD Price Analysis: Exhibits sluggishness amid uncertainty over timing of Fed rate cuts
Disclaimer: The Content is for informational purposes only; you should not construe any such information or other material as legal, tax, investment, financial, or other advice. Nothing ...
more

