

Photo by Thomas Coker on Unsplash
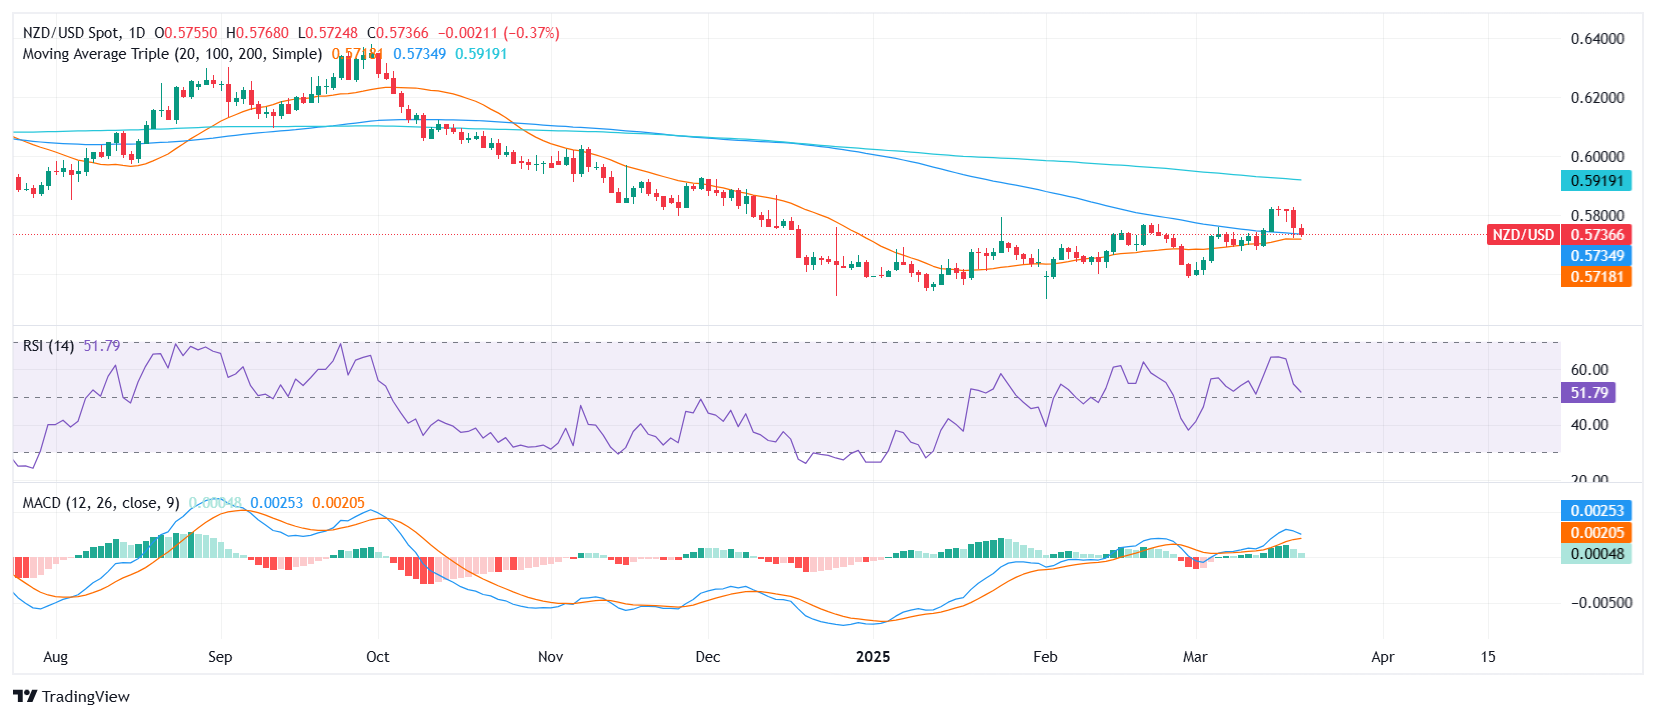
- NZD/USD was seen around the 0.5730 zone, posting modest daily losses ahead of the Asian session.
- The pair is testing a key confluence of the 20 and 100-day moving averages, with downside risks emerging below this area.
During Friday’s session ahead of the Asian open, NZD/USD declined modestly and was last seen hovering around the 0.5730 area. The pair remains under pressure after sellers stepped in earlier in the day, with price action now centered around the convergence of the 20-day and 100-day Simple Moving Averages—a key technical juncture for the short-term outlook.
The Relative Strength Index (RSI) has sharply dropped but still holds in the positive region, hovering just above the 50 mark, suggesting that bullish momentum is fading. The Moving Average Convergence Divergence (MACD) remains above zero, but its histogram is printing smaller green bars, reflecting weakening upside pressure.
Technically, a clean break below the 0.5730 support area—where the 20-day and 100-day SMAs intersect—could expose the pair to a deeper pullback toward 0.5680 and then the 0.5620 zone. On the flip side, if buyers manage to defend this support cluster, recovery attempts could target resistance around 0.5780 and 0.5820 next.
NZD/USD daily chart
More By This Author:
AUD/JPY Price Analysis: Aussie Dips Slightly As 20-Day SMA Offers SupportUS Dollar Continues Recovering Ahead Of The Weekend
AUD/USD Hangs Near Weekly Low, Remains Depressed Below 0.6300 On Stronger USD


Comments
Log in or sign up to join the conversation.