

Photo by Thomas Coker on Unsplash
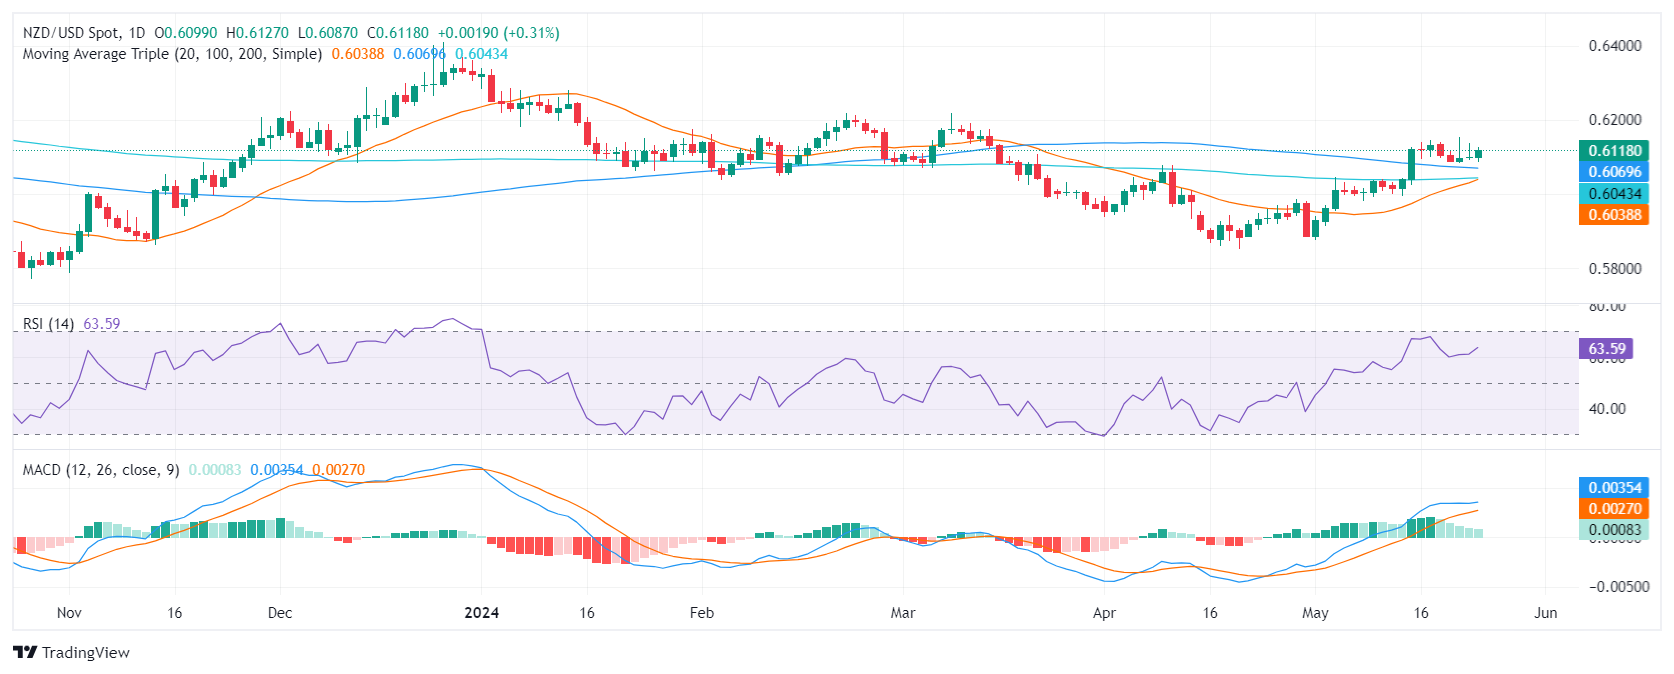
- The daily indicators remain in positive territory but somewhat flattened .
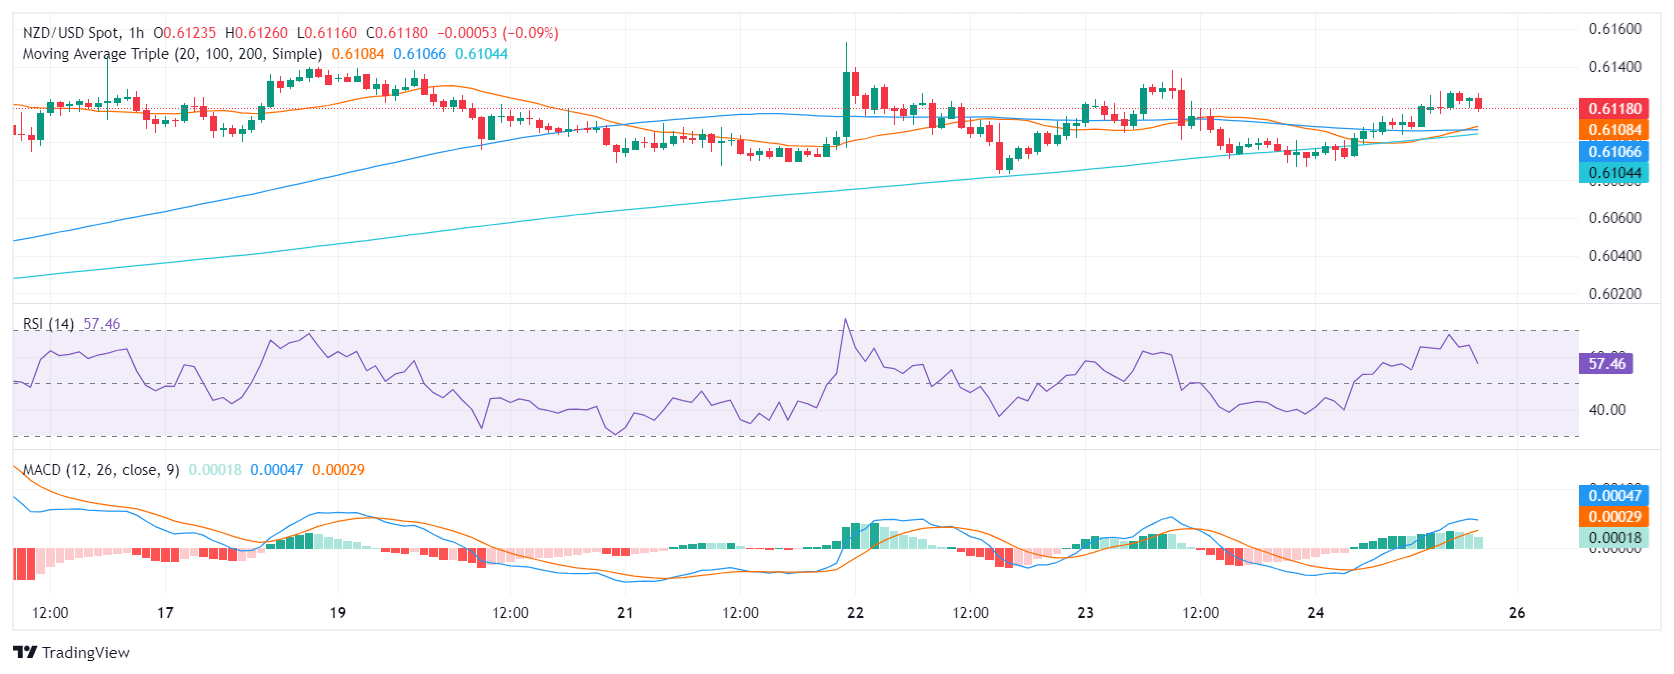
- The hourly charts reveal a temporary dip in the RSI and a MACD flattening, signaling a possible short-term consolidation.
- Pending bullish crossover between the 200 and 100-day SMA at 0.6040 could bolster the bullish momentum in future sessions.
During Friday's session, NZD/USD rose towards the 0.6125 level. The positive trajectory of the pair continues to convey a strong buyer influence in the market. However, echoes of consolidation may suggest a breather following the recent surge which pushed the pair above the 100 and 200-day Simple Moving Averages (SMA).
Examining the daily chart of the NZD/ pair, it is apparent that the Relative Strength Index (RSI) reveals a robust positive trend. After a close approach to overbought conditions at 69, the RSI receded to a still positive level of 63. In line with that, the Moving Average Convergence Divergence (MACD) prints flat green bars which may suggest a flattening momentum.
NZD/USD daily chart
Transitioning to the hourly chart, there is a discernible decreasing trend in the RSI readings, with figures retreating from 64 to 57 throughout Friday’s session. The MACD histogram aligns with this pattern, with flat green bars that signal reduced upward momentum.
NZD/USD hourly chart
From a broader perspective, the position of NZD/USD suggests a strong bullish trend. Trading above the Simple Moving Averages (SMA) of 20, 100, and 200-day, the pair displays upward momentum both on short-term and long-term scales.
Incorporating both the daily and hourly RSI trends, along with MACD and SMA positioning, the conclusion is drawn that the NZD/USD may need some respite after its recent surge. Despite this, the market structure maintains its bullish tone.
NZD/USD
| OVERVIEW | |
|---|---|
| Today last price | 0.6118 |
| Today Daily Change | 0.0019 |
| Today Daily Change % | 0.31 |
| Today daily open | 0.6099 |
| TRENDS | |
|---|---|
| Daily SMA20 | 0.603 |
| Daily SMA50 | 0.6003 |
| Daily SMA100 | 0.6071 |
| Daily SMA200 | 0.6042 |
| LEVELS | |
|---|---|
| Previous Daily High | 0.6138 |
| Previous Daily Low | 0.6091 |
| Previous Weekly High | 0.6146 |
| Previous Weekly Low | 0.5995 |
| Previous Monthly High | 0.6079 |
| Previous Monthly Low | 0.5851 |
| Daily Fibonacci 38.2% | 0.612 |
| Daily Fibonacci 61.8% | 0.6109 |
| Daily Pivot Point S1 | 0.6081 |
| Daily Pivot Point S2 | 0.6062 |
| Daily Pivot Point S3 | 0.6033 |
| Daily Pivot Point R1 | 0.6128 |
| Daily Pivot Point R2 | 0.6157 |
| Daily Pivot Point R3 | 0.6175 |
More By This Author:
GBP/JPY Rises After UK Inflation Data Beats Analysts’ EstimatesOil Flattens Despite Heightened Tensions Over Recognition Of Palestinian State
Gold Price Edges Lower For Second Day On Bleak Interest-Rate Outlook


Comments
Log in or sign up to join the conversation.