

Photo by Thomas Coker on Unsplash
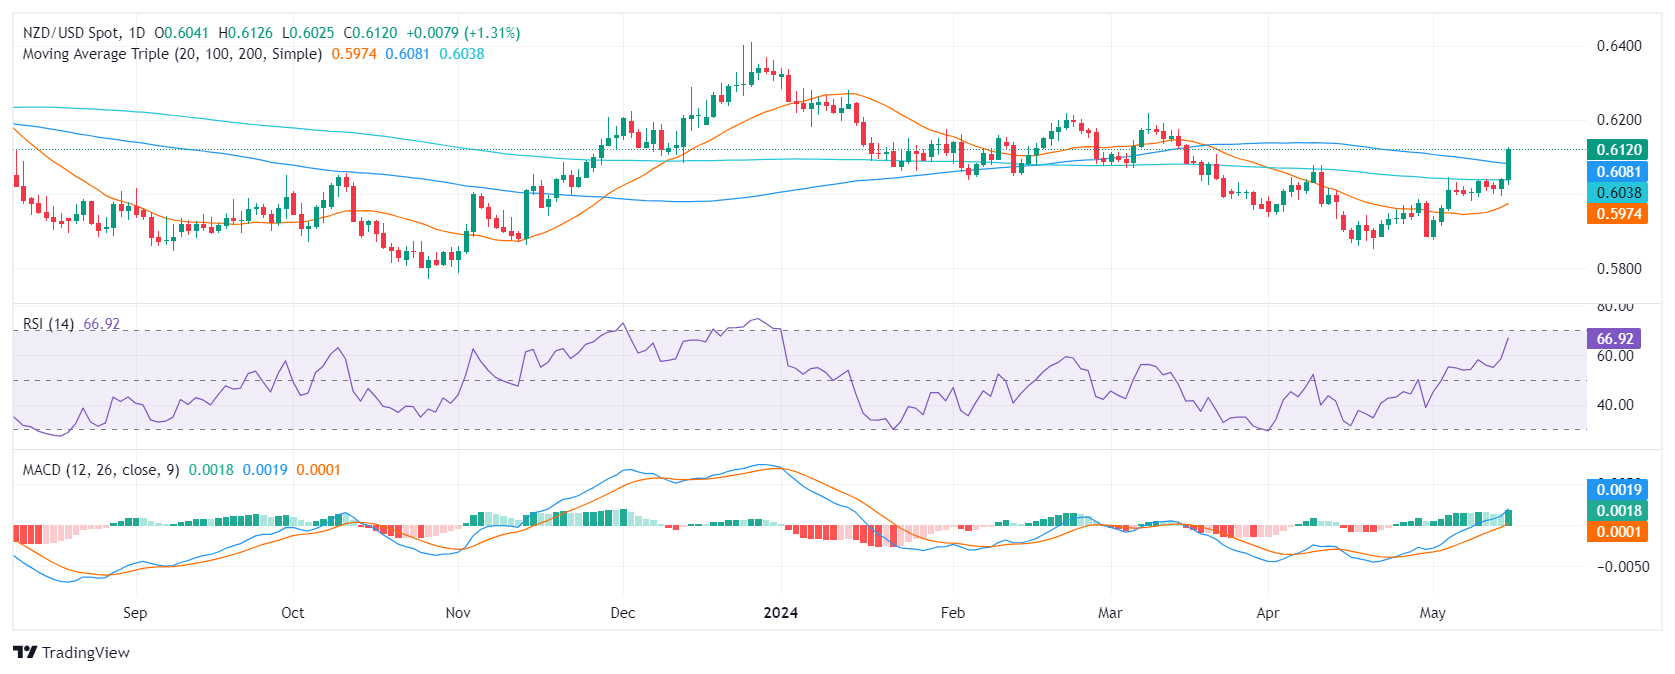
- The daily RSI of the NZD/USD signals it is approaching overbought, which often indicates future consolidation or potential reversal.
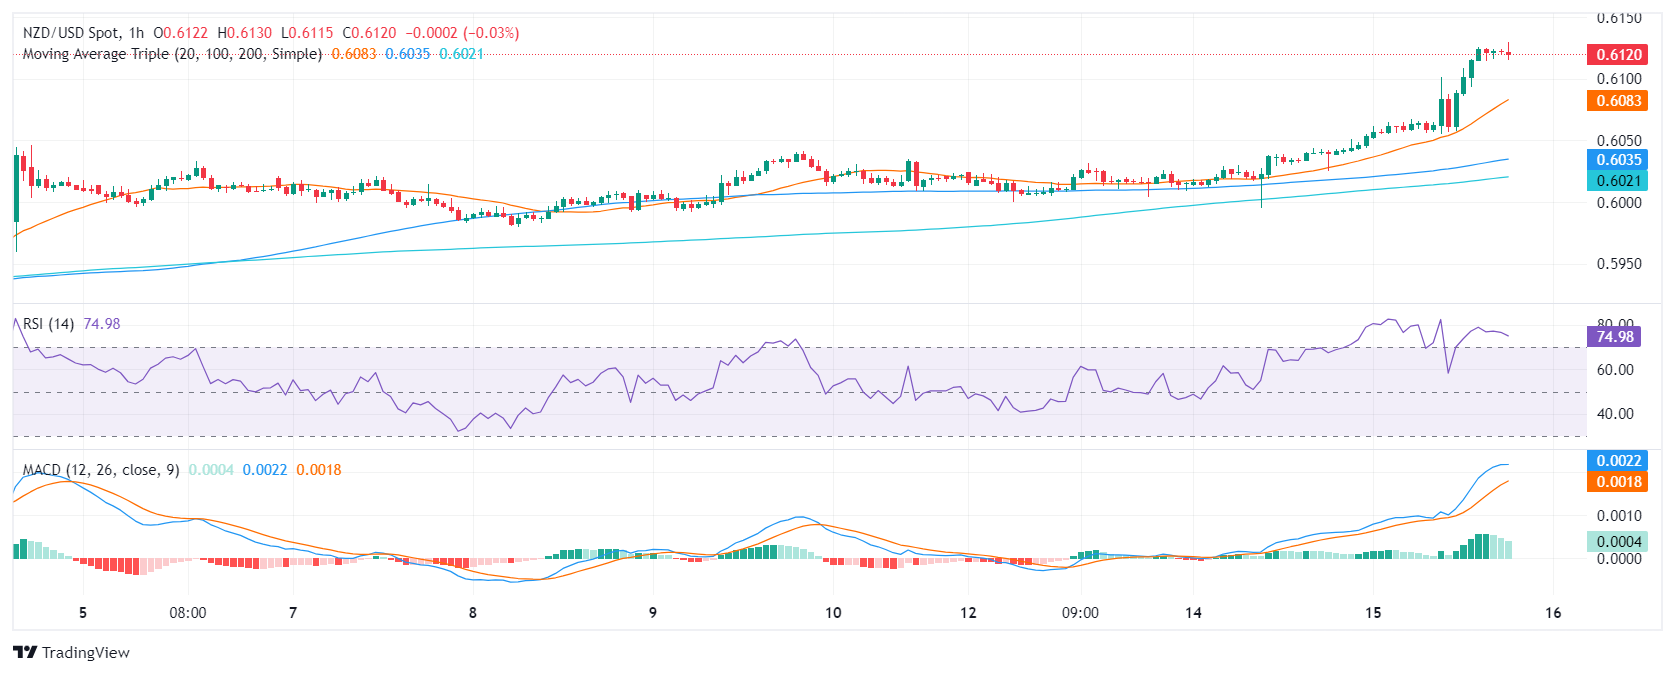
- The same indicators in the hourly chart further strengthen this view, specifically, with the RSI crossing the 70 mark.
- Buyers regained the 100 and 200-day SMAs, and this points to a bullish outlook.
In the Wednesday session, the NZD/USD pair rides a strong bullish wave, with a recent increase of 1.28%. The uptick made the pair jump above its 100 and 200-day Simple Moving Averages (SMAs), indicating that the outlook turned positive for the pair. However, as indicators approach overbought conditions, a consolidation may be incoming.
On the daily chart, the Relative Strength Index (RSI) indicates that NZD/USD is approaching overbought territory. The positive trend evident over the past few days, along with the recent surge, reveals that the strength is currently with buyers. However, this upward pressure may soon decrease, as the RSI nearing overbought conditions often signals future consolidation or potential reversal.
NZD/USD daily chart
The hourly chart shows that RSI readings exceeded 70, reinforcing indications of overbought conditions. The recent Moving Average Convergence Divergence (MACD) showing flat green bars indicates sustained but flat positive momentum.
NZD/USD hourly chart
In conclusion, the technical indicators for NZD/USD suggest strong buyer momentum. However, the RSI's proximity to overbought conditions hints at a potential easing of this upward pressure. This, coupled with the strong bullish trend indicated by the jumping above longer-term SMAs, presents a positive outlook but demands careful observation for potential corrections.
NZD/USD
| OVERVIEW | |
|---|---|
| Today last price | 0.6118 |
| Today Daily Change | 0.0077 |
| Today Daily Change % | 1.27 |
| Today daily open | 0.6041 |
| TRENDS | |
|---|---|
| Daily SMA20 | 0.5964 |
| Daily SMA50 | 0.6009 |
| Daily SMA100 | 0.6084 |
| Daily SMA200 | 0.6038 |
| LEVELS | |
|---|---|
| Previous Daily High | 0.6044 |
| Previous Daily Low | 0.5995 |
| Previous Weekly High | 0.6041 |
| Previous Weekly Low | 0.598 |
| Previous Monthly High | 0.6079 |
| Previous Monthly Low | 0.5851 |
| Daily Fibonacci 38.2% | 0.6025 |
| Daily Fibonacci 61.8% | 0.6014 |
| Daily Pivot Point S1 | 0.6009 |
| Daily Pivot Point S2 | 0.5978 |
| Daily Pivot Point S3 | 0.596 |
| Daily Pivot Point R1 | 0.6058 |
| Daily Pivot Point R2 | 0.6076 |
| Daily Pivot Point R3 | 0.6107 |
More By This Author:
Silver Price Analysis: Reaches new high for May but pulls back after becoming overboughtEUR/JPYRises Close To 168.00 On Continued Interest Rate Differential
EUR/JPY Price Analysis: Bullish Forces Steering The Market, Minor Pullbacks Possible


Comments
Log in or sign up to join the conversation.