

Image Source: Unsplash
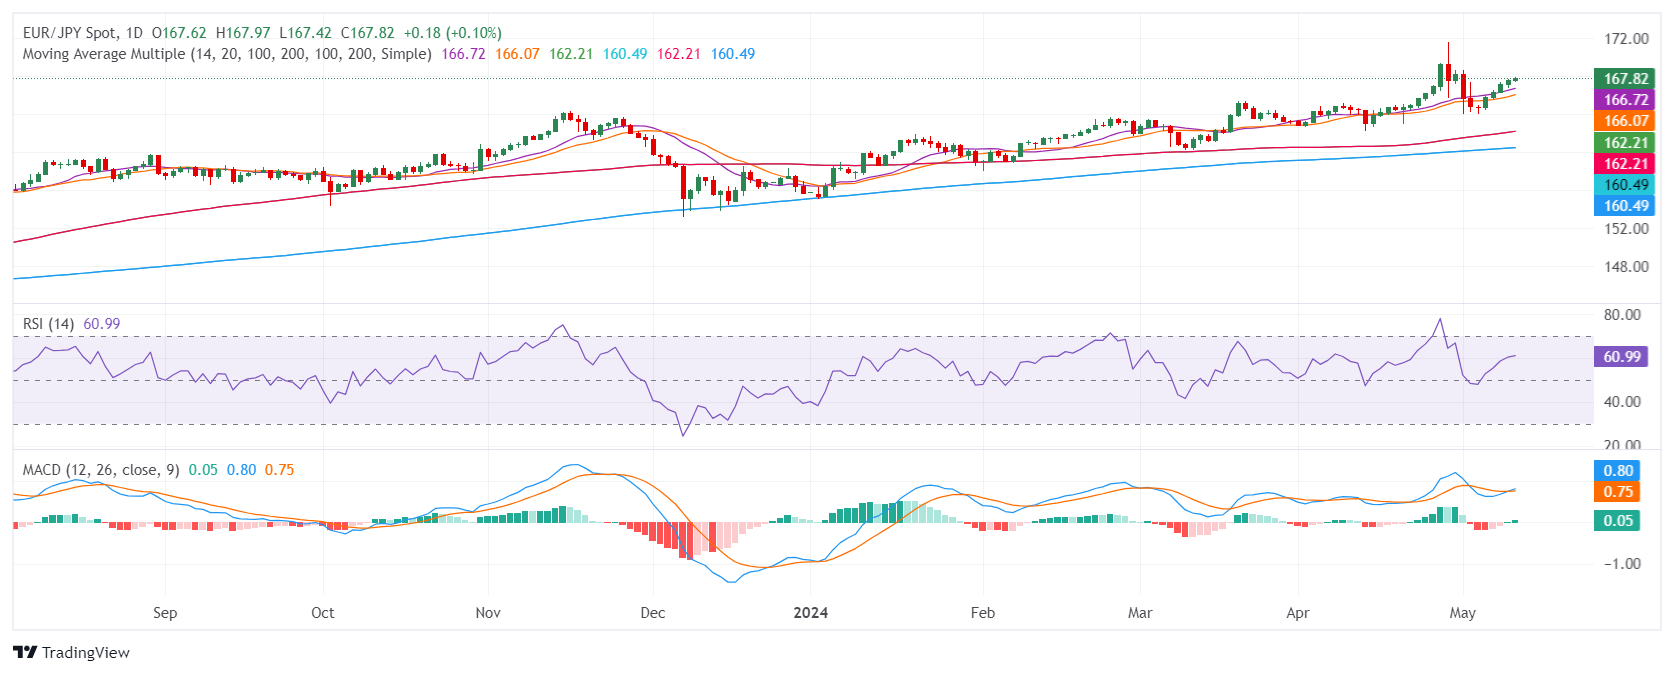
- The daily EUR/JPY RSI reveals ongoing bullish momentum, demonstrating a stable shift from 44 to 60 in the last sessions.
- Daily MACD perspectives align with the RSI, implying further progression of the positive momentum.
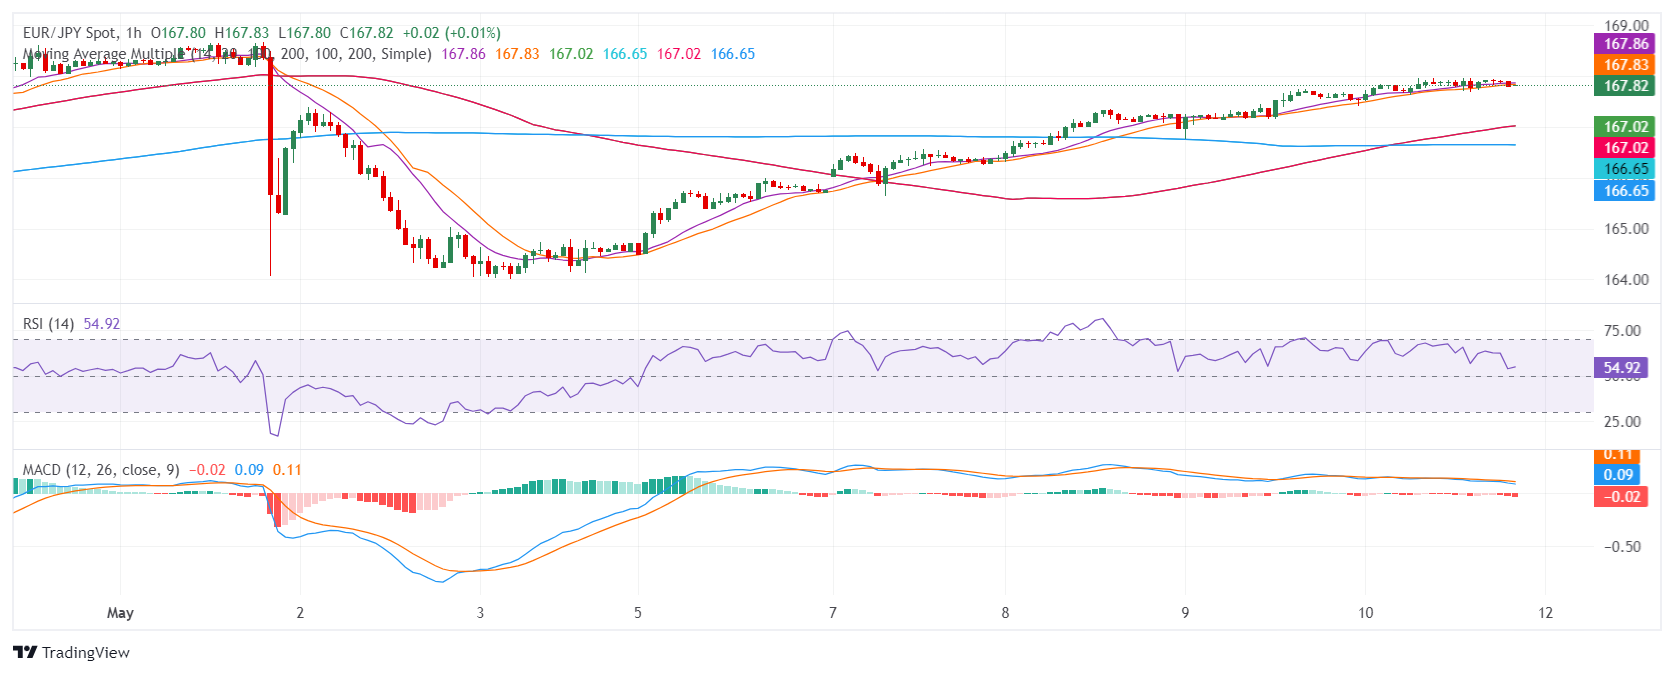
- Hourly chart shows a dip in RSI to 53 and indicates rising sellers' traction, suggesting a temporary pause in ongoing bullish momentum.
The EUR/JPY has been dominating with a steady bullish trend. It rose to 167.85 on Friday, reflecting a positive momentum primarily driven by market buyers. However, short-term sellers seem to be upping their game, implying potential transient pullbacks as indicators are flashing overbought signals in the hourly chart.
On the daily chart, the Relative Strength Index (RSI) for the EUR/JPY. A stable increase from since last week 44 to the current reading of 60 reveals an ongoing bullish momentum, primarily driven by market buyers. The Moving Average Convergence Divergence (MACD) corresponds with this perspective by showcasing rising green bars, indicating that the positive momentum is further progressing.
EURJPY daily chart
Looking at the hourly chart, the RSI presents a slight pullback to 53.26 after peaking at 67.40. While this indicates a potential slowing of buying dominance, the MACD, emphasized by rising red bars, suggests the formation of negative momentum. Despite the noticeable shift in the hourly chart, the dominant daily bullish outlook remains unchanged.
EURJPY hourly chart
In assessing the bigger picture, the EUR/JPY is positioned above its Simple Moving Averages (SMA) for the 20, 100, and 200-day periods which suggests that the buyers are clearly in command.
EUR/JPY
| OVERVIEW | |
|---|---|
| Today last price | 167.8 |
| Today Daily Change | 0.16 |
| Today Daily Change % | 0.10 |
| Today daily open | 167.64 |
| TRENDS | |
|---|---|
| Daily SMA20 | 165.83 |
| Daily SMA50 | 164.28 |
| Daily SMA100 | 162.1 |
| Daily SMA200 | 160.43 |
| LEVELS | |
|---|---|
| Previous Daily High | 167.75 |
| Previous Daily Low | 166.76 |
| Previous Weekly High | 171.6 |
| Previous Weekly Low | 164.02 |
| Previous Monthly High | 171.6 |
| Previous Monthly Low | 162.28 |
| Daily Fibonacci 38.2% | 167.37 |
| Daily Fibonacci 61.8% | 167.14 |
| Daily Pivot Point S1 | 167.02 |
| Daily Pivot Point S2 | 166.39 |
| Daily Pivot Point S3 | 166.03 |
| Daily Pivot Point R1 | 168.01 |
| Daily Pivot Point R2 | 168.37 |
| Daily Pivot Point R3 | 169 |
More By This Author:
Oil Price Analysis: Falling In A Channel Over The Short-TermAUD/USD Price Analysis: Pausing Within New Uptrend
NZD/USD Price Analysis: Bulls Stuck At 0.6000 As Momentum Lightens


Comments
Log in or sign up to join the conversation.