

Photo by Thomas Coker on Unsplash
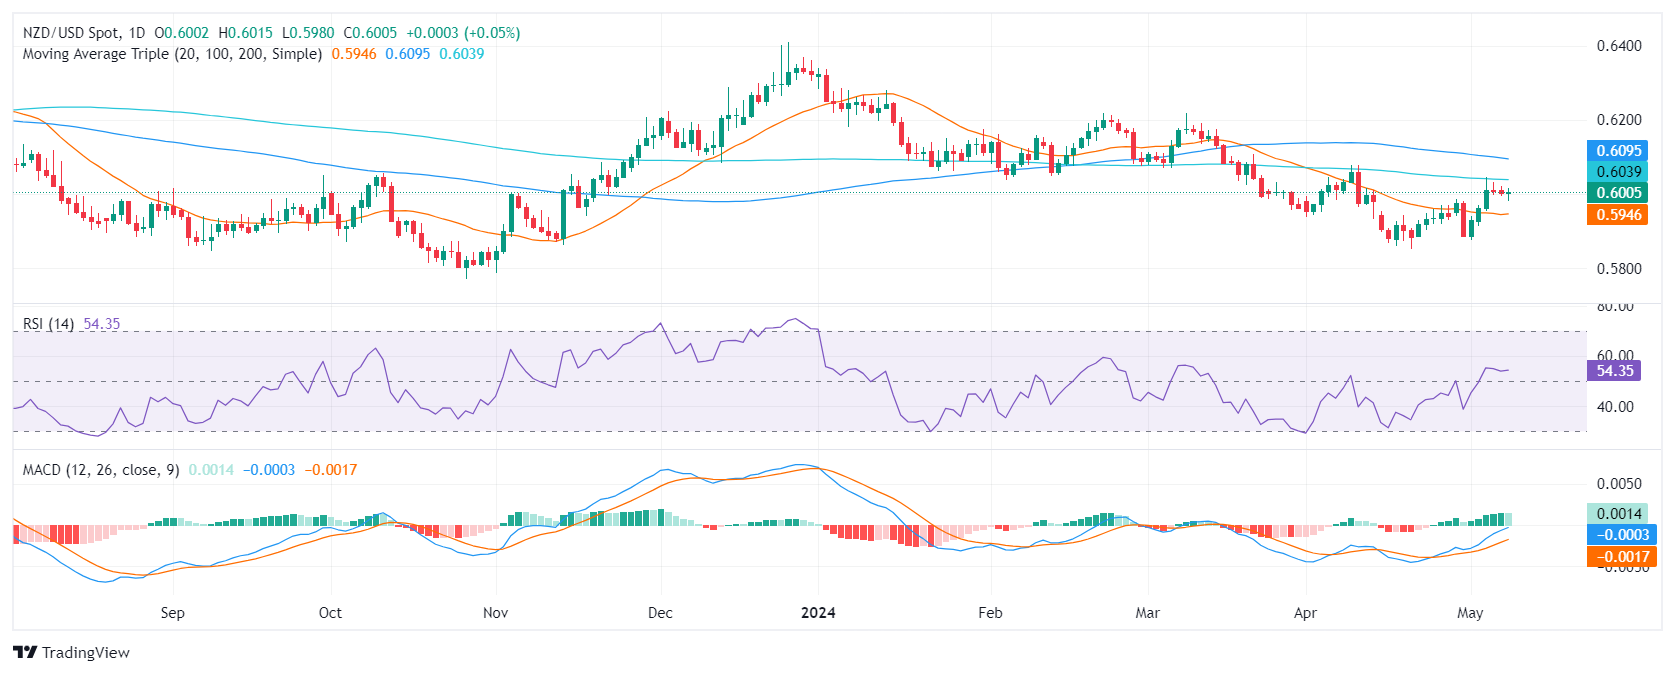
- Indicators on the daily chart shows decelerating bullish momentum.
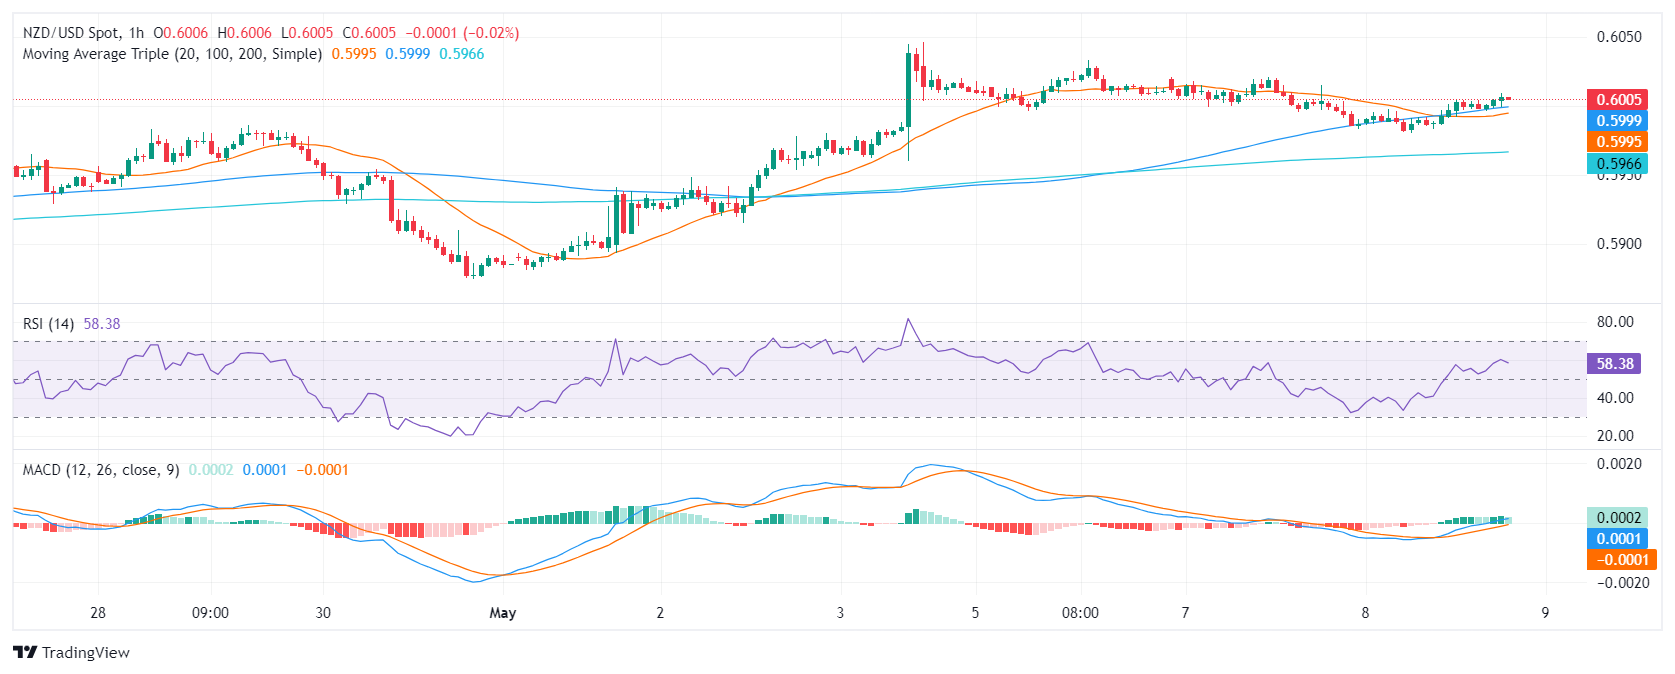
- The RSI on the hourly chart indicates fluctuating buying and selling pressures, despite its position in the positive zone.
- For bulls to avoid losses, they must defend the key 20-day SMA.
The NZD/USD pair maintains a strong bearish bias despite recent upward movements as buyers seem to have stalled at around 0.6000 and struggle to gain further ground while momentum wanes.
On the daily chart, technical indicators suggest a decelerating positive momentum for the pair while the prevailing downtrend persists. The Relative Strength Index (RSI) shows a positive trend after a slow ascend from the oversold region. However, the Moving Average Convergence Divergence (MACD) histogram reveals a transition towards diminishing green bars, indicating a decelerating bullish momentum.
NZD/USD daily chart
Contrastingly, the hourly RSI sits at 54. Although this is still in the positive territory, it is marginally edging lower. The past few hours have witnessed noticeable fluctuations, signaling varied buying and selling pressures. The hourly chart's MACD registers a decrease in green bars, implying receding positive momentum.
NZD/USD hourly chart
Broadening the perspective further reveals that the NZD/USD is caught in a downtrend as it lies beneath the 100 and 200-day Simple Moving Averages (SMA). That being said, its position above the 20-day average still gives some light to the bulls as it hints at a short-term positive outlook. In summary, the technical indicators of the NZD/USD pair suggest a slowing positive momentum on both the daily and hourly charts, while the prevailing downtrend continues.
NZD/USD
| OVERVIEW | |
|---|---|
| Today last price | 0.6006 |
| Today Daily Change | 0.0004 |
| Today Daily Change % | 0.07 |
| Today daily open | 0.6002 |
| TRENDS | |
|---|---|
| Daily SMA20 | 0.5945 |
| Daily SMA50 | 0.6016 |
| Daily SMA100 | 0.6097 |
| Daily SMA200 | 0.6039 |
| LEVELS | |
|---|---|
| Previous Daily High | 0.6021 |
| Previous Daily Low | 0.5995 |
| Previous Weekly High | 0.6046 |
| Previous Weekly Low | 0.5875 |
| Previous Monthly High | 0.6079 |
| Previous Monthly Low | 0.5851 |
| Daily Fibonacci 38.2% | 0.6005 |
| Daily Fibonacci 61.8% | 0.6011 |
| Daily Pivot Point S1 | 0.5991 |
| Daily Pivot Point S2 | 0.598 |
| Daily Pivot Point S3 | 0.5965 |
| Daily Pivot Point R1 | 0.6017 |
| Daily Pivot Point R2 | 0.6032 |
| Daily Pivot Point R3 | 0.6043 |
More By This Author:
AUD/USD Price Analysis: Pulling Back Within A Short-Term UptrendUS Dollar Closes A Losing Week Following Soft NFP
Gold Price Remains On Tenterhooks With Eyes On Fed Policy Decision


Comments
Log in or sign up to join the conversation.