

Photo by Thomas Coker on Unsplash
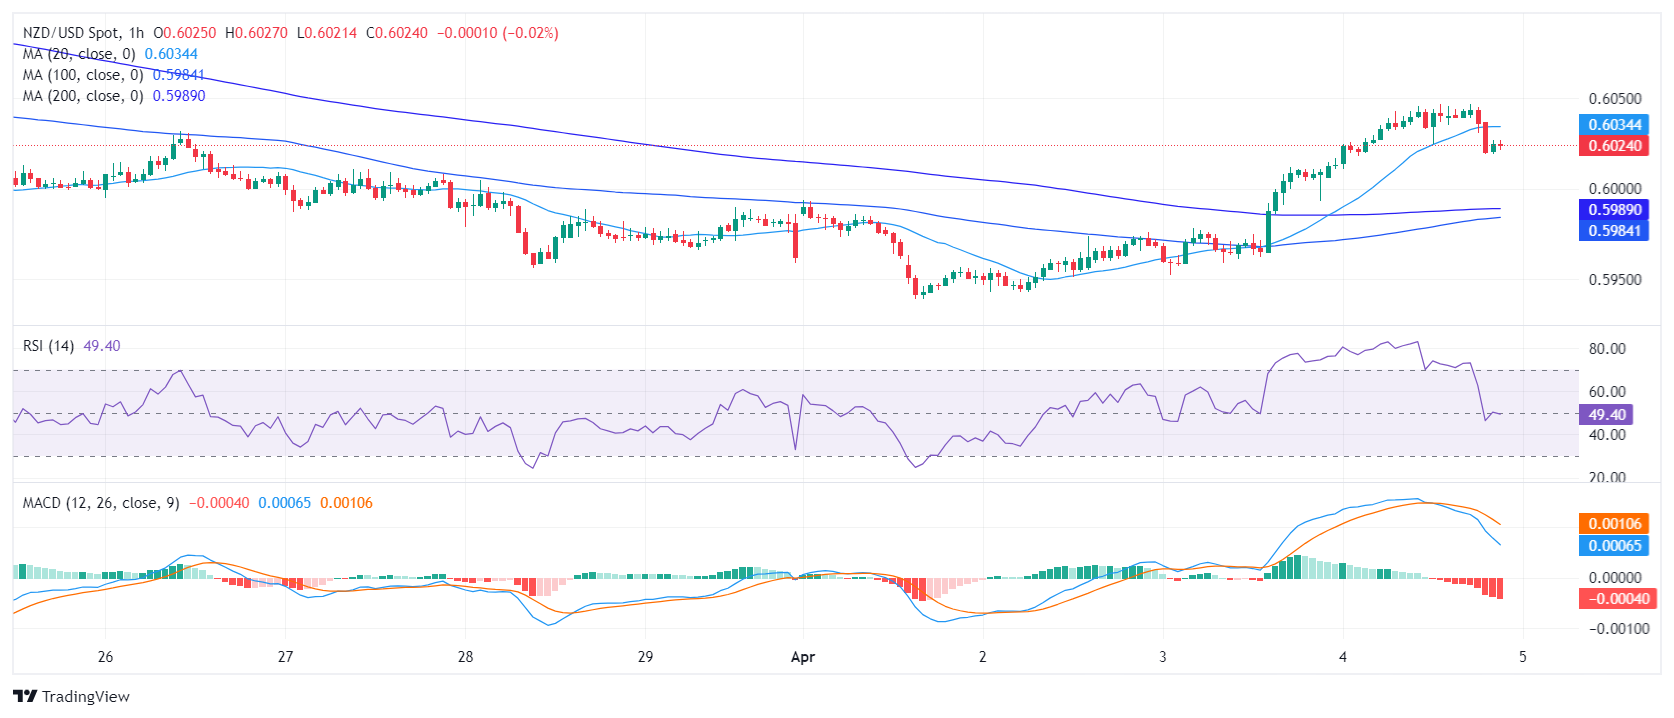
- The hourly chart signals a possible short-term rise in selling pressure with a shar decline in the RSI.
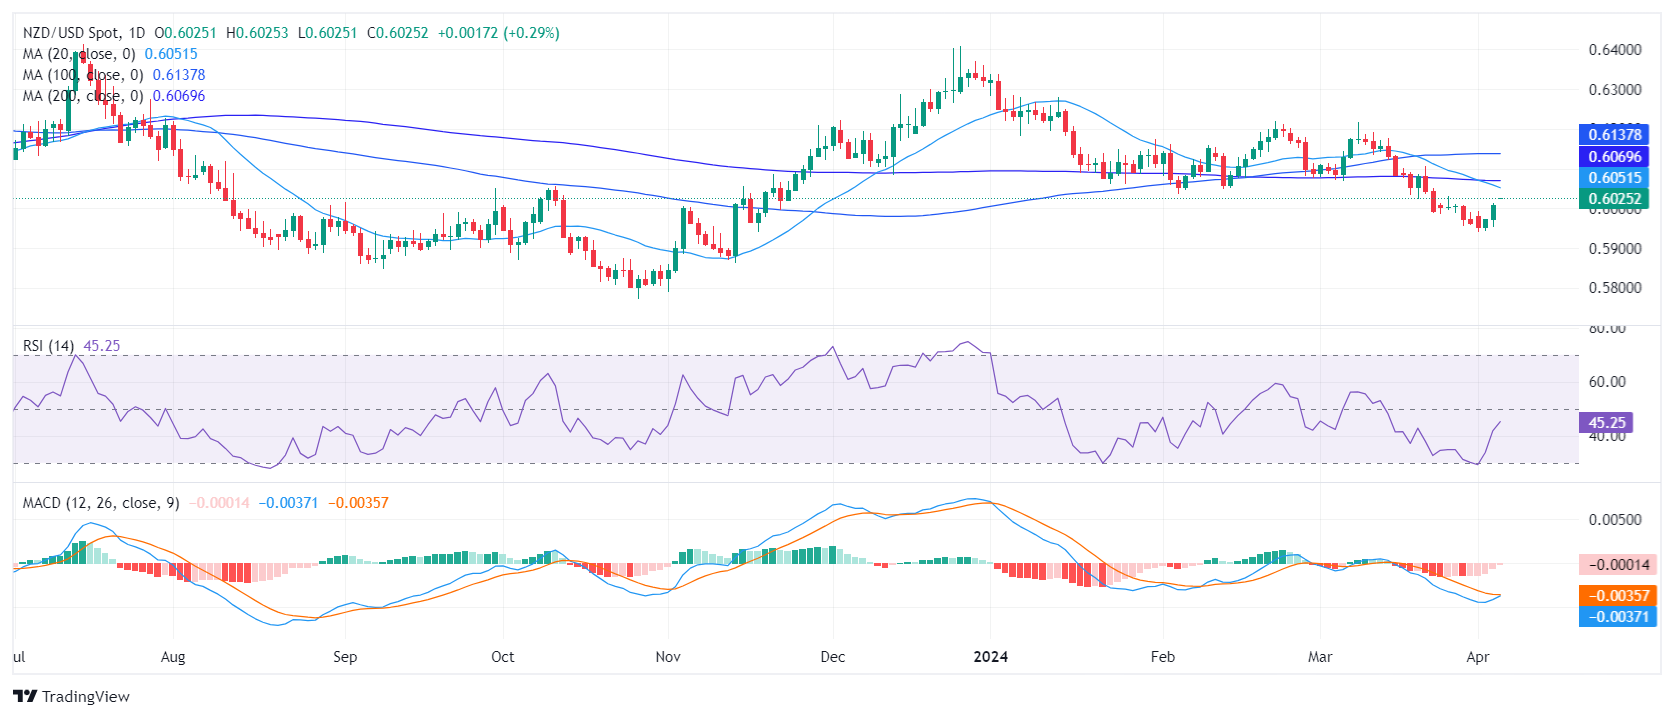
- The negative outlook remains on the daily chart.
- The bearish crossover between the 20 and 200-day SMAs implies a strong negative momentum.
The NZD/USD pair is trading at around 0.6025 and trimmed most of its daily gains on Thursday. After getting rejected by the 20-day Simple Moving Average (SMA) the latest upwards movements seem to have been short-lived and didn’t present a battle to the bearish overall trend.
On the daily chart, the Relative Strength Index (RSI) has shown slow movement from negative to positive territory over past sessions and now resides at around 47.15. However, the flat red bars of the Moving Average Convergence Divergence (MACD) indicate a steady negative momentum.
NZD/USD daily chart
On the hourly chart, the RSI proved more erratic, reaching a positive value of 70 earlier in the session and dropping to 50. This fluctuation suggests a possible short-term shift in momentum favoring the sellers. The MACD, continues to print red flat bars, indicating sustained negative momentum throughout recent hours.
NZD/USD hourly chart
Concerning its Simple Moving Averages (SMAs), the NZD/USD is below the 20,100 and 200-day SMAs. Thursday’s 20-day SMA rejection adds further arguments that the bullish momentum is weak. Moreover, the mentioned average completed a bearish crossover with the 200-day SMA which may eventually limit any upward momentum.
NZD/USD
| OVERVIEW | |
|---|---|
| Today last price | 0.6025 |
| Today Daily Change | 0.0017 |
| Today Daily Change % | 0.28 |
| Today daily open | 0.6008 |
| TRENDS | |
|---|---|
| Daily SMA20 | 0.6059 |
| Daily SMA50 | 0.6096 |
| Daily SMA100 | 0.6137 |
| Daily SMA200 | 0.607 |
| LEVELS | |
|---|---|
| Previous Daily High | 0.6012 |
| Previous Daily Low | 0.5952 |
| Previous Weekly High | 0.6032 |
| Previous Weekly Low | 0.5956 |
| Previous Monthly High | 0.6218 |
| Previous Monthly Low | 0.5956 |
| Daily Fibonacci 38.2% | 0.5989 |
| Daily Fibonacci 61.8% | 0.5975 |
| Daily Pivot Point S1 | 0.5969 |
| Daily Pivot Point S2 | 0.5931 |
| Daily Pivot Point S3 | 0.5909 |
| Daily Pivot Point R1 | 0.6029 |
| Daily Pivot Point R2 | 0.6051 |
| Daily Pivot Point R3 | 0.6089 |
More By This Author:
Pound Sterling Is At Fresh Two-Week Lows Testing The 1.2675 Resistance AreaEUR/USD Recovers On Weaker US Services PMIs
Gold Price Stands Tall Near Record High, Around $2,300 Amid Geopolitical Risks


Comments
Log in or sign up to join the conversation.