

Image Source: Unsplash
- NZD/JPY mildly declined in Tuesday's session, landing at 89.40.
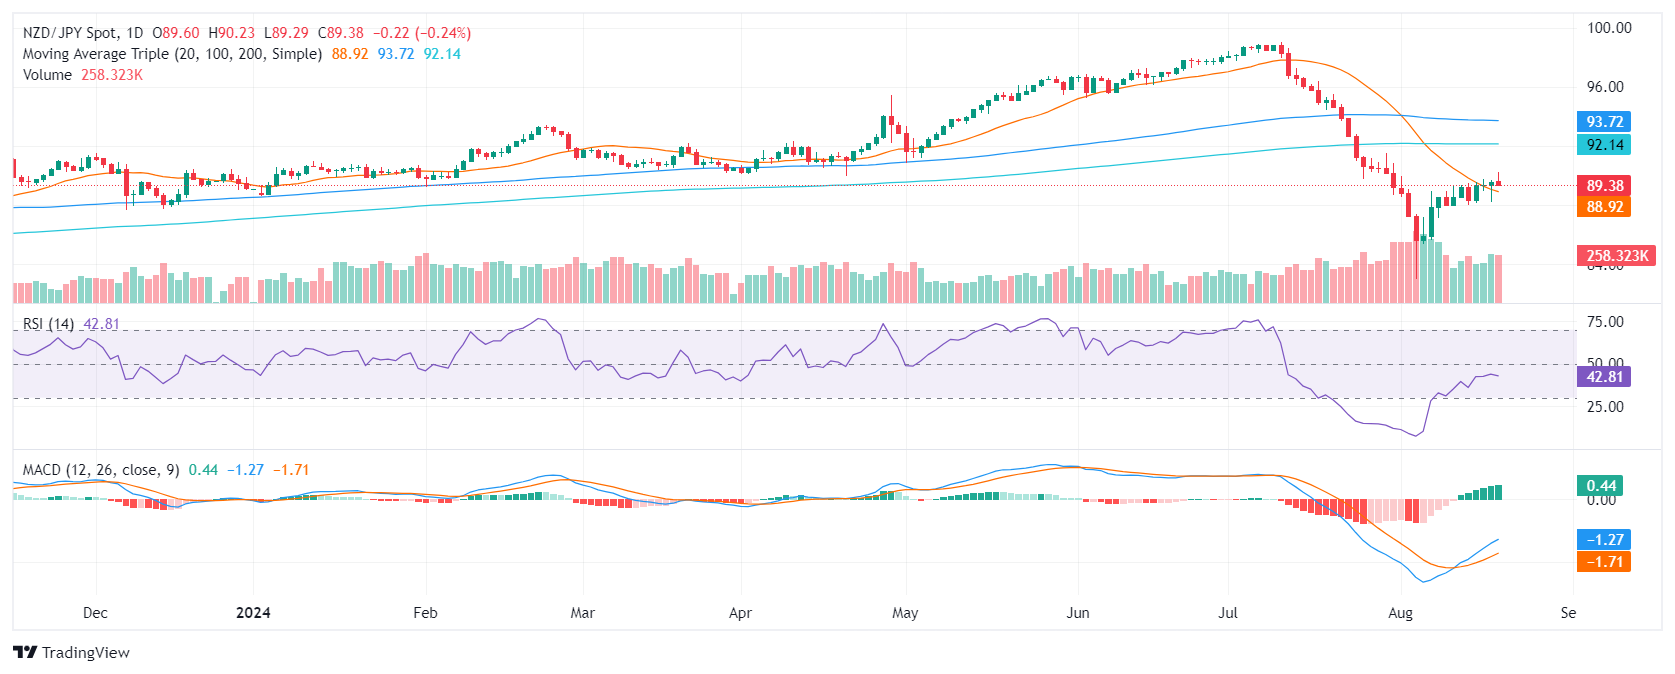
- The RSI flattened around 40, indicating a potential bearish trend while the MACD remains neutral with green bars, suggesting a lack of clear momentum.
- The pair continues trading within a range of 87.50 and 90.50.
The NZD/JPY currency pair has experienced continued sideways trading despite Tuesday's modest decline of 0.15%, settling at 89.40. Technical indicators paint a mixed picture, with the Relative Strength Index (RSI) and the Moving Average Convergence Divergence (MACD) hinting at mild a bearish bias.
The RSI remains neutral around 42, suggesting that the bears are present. If the RSI continues to move below, it would indicate a potential strong bearish reversal. The MACD is showing flat green bars, suggesting that there is no clear momentum in either direction. For the MACD, if the flat green bars progress to red bars, it will suggest increasing bearish momentum and a potential strong reversal.
Volume has been consistently low, indicating a lack of conviction in the recent price movements. The pair is currently trading within a range between 87.50 and 90.50. A break below 87.50 could lead to further declines towards 86.00, while a break above 90.50 could push the pair up to 92.00.
NZD/JPY Daily chart
More By This Author:
AUD/JPY Price Prediction: Consolidates Near Monthly Top, 100.00 Confluence Holds The Key For BullsCanada CPI Set To Show Easing Price Pressures, Bolstering BoC To Further Ease Policy
WTI Drops To Nearly Two-Week Low Amid Optimism Over Gaza Ceasefire Talks


Comments
Log in or sign up to join the conversation.