March ISM Manufacturing PMI Hits Highest Level Since 1983, USD Rotates Higher
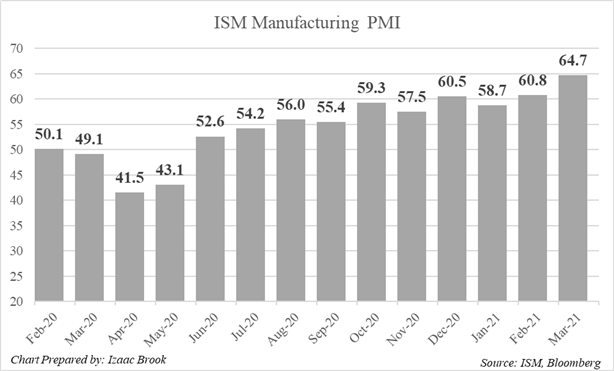
US manufacturing activity in March strongly beat expectations as the ISM Manufacturing PMI printed at 64.7 versus a forecast of 61.3, the index’s highest readout since 1983. February’s print shows continued strength from the manufacturing sector. The new orders component of the report hit its highest level since 2004, and the employment index rose to its highest point since 2018.

The accompanying ISM press release noted, among other details, that manufacturers have struggled to cope with the surging number of new orders as demand rises and supply chain are disrupted. The fastest rates of increase were reported among consumer goods, as stimulus checks fueled increased spending. The prices component of the index printed slightly above forecast at 85.6 vs. 85.0 expected, but below February’s level of 86.
Manufacturing PMI serves as an important proxy for US GDP data, giving markets a closer and more timely look at an important component of the US economy. PMI prints above 50 denote an expansion and below 50 denote a contraction. March’s Markit PMIs for the Euro area printed above expectations in late March while the US figures printed broadly in-line with expectations.
Recent US economic data shows the economic recovery continuing along. Tuesday’s print in Consumer Confidence saw the index strongly beat expectations as it jumped to a pandemic high. The impact of the Biden administration’s stimulus bill has started feeding through into economic data in March and April, providing further support to the economy. Overall, the economy is well-positioned for a strong second half of the year.
While strong vaccination efforts have driven consumer confidence to pandemic highs, virus-related risks remain. US cases seem to be on the uptrend again, especially in states in the northeast. Fears over new virus variants and worries over vaccine effectiveness against new variants could derail the recovery.
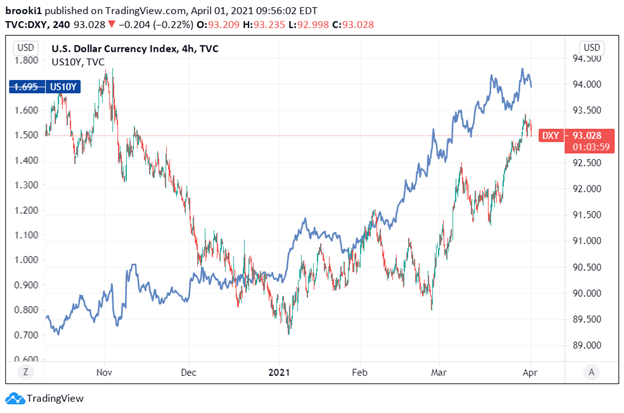
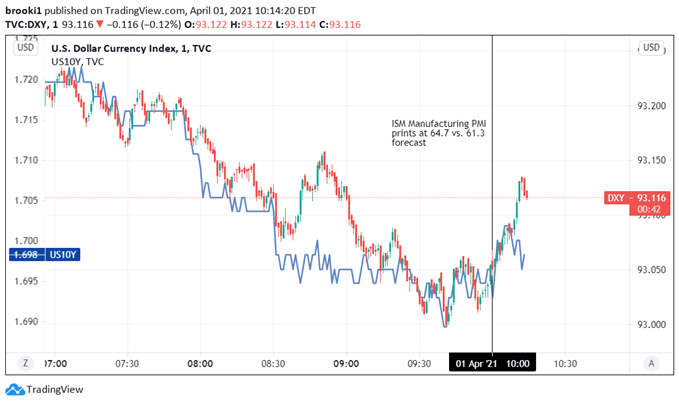
After falling to a three-week low around 89.75 in late February, the US Dollar rebounded as longer-term yields moved higher. The DXY rose as high as 92.50 in early March before edging slightly downward and consolidating below the 92.00 level through mid-March. On March 23rd, the DXY began to rally again, rising from 91.80 to break above the 93.00 level for the first time since early November 2020. The DXY traded lower ahead of the Manufacturing ISM print, falling to near the 93.00 level as US 10yr yields fell below 1.70% for the first time in days.
DXY INDEX AND 10YR TREASURY YIELDS: 4 HOUR TIME FRAME (NOVEMBER 2020 - APRIL 2021)

Chart Prepared by Izaac Brook, Source: TradingView
The DXY and US 10yr yields both jumped higher in the immediate aftermath of the print, rotating back above 93.10 and towards the 1.70% level, respectively. Strong surprises in US economic data may become more frequent in the near future as vaccinations continue and the economy reopens, providing a further tailwind to the USD and other risk assets.
DXY INDEX AND 10YR TREASURY YIELDS: 1 MINUTE TIME FRAME (APRIL 1ST, 2021)

Chart Prepared by Izaac Brook, Source: TradingView
Disclosure: See the full disclosure for DailyFX here.


