
It’s A Mixed Bag
In this week’s Dirty Dozen [CHART PACK] we look at the deteriorating short-term backdrop for US equities while arguing why it’s best to stay long until the tape says its time to get out. We then talk about hot job numbers, a pickup in annualized inflation data, a long USD play, and a bombed-out nuclear stock that’s found a bottom, plus more…
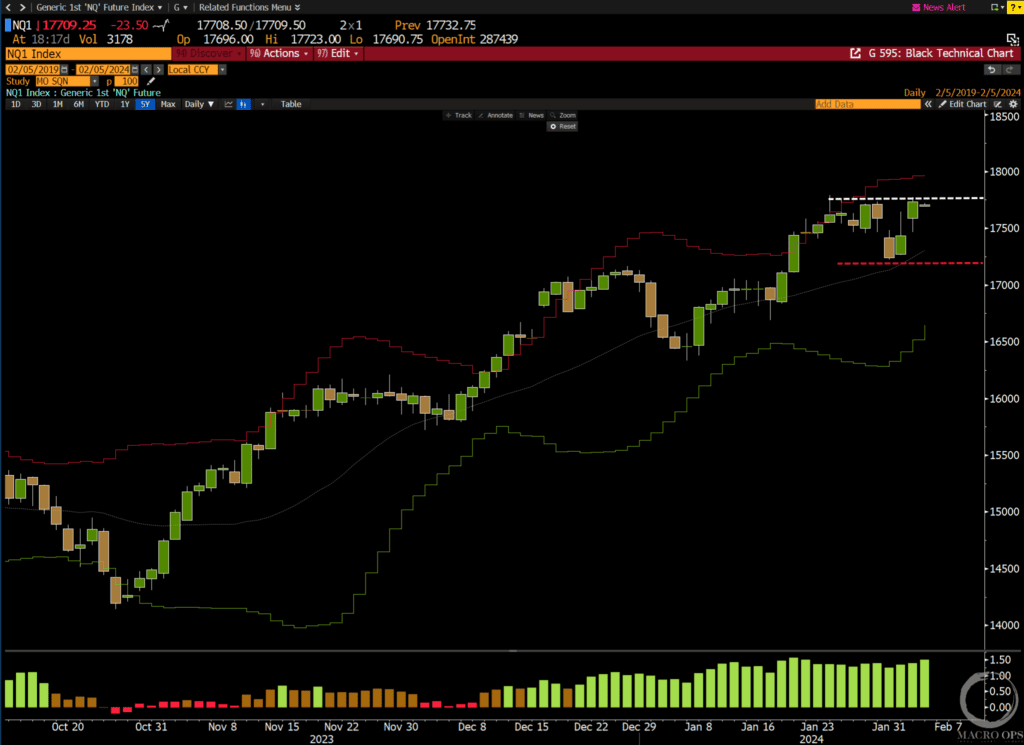
1. The market is trading near all-time highs (Qs pictured below) but we’re still seeing a large number of traders trying to short this move. While we’re more cautious due to the high Trend Fragility readings and recent shift in rate cut expectations, we don’t think it’s good policy to fade a strong trend. We’d much prefer to play to the long side, move up stops, and wait for the trend to bend… A move below the recent pivot low (red line) is a good technical inflection.
(Click on image to enlarge)
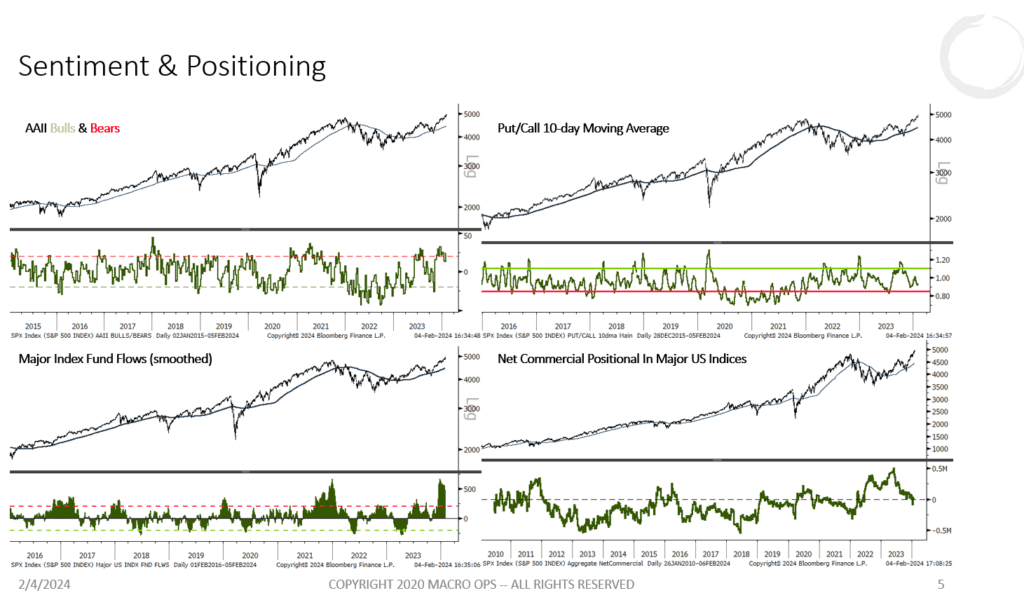
2. Some components of our Trend Fragility indicator below.
(Click on image to enlarge)
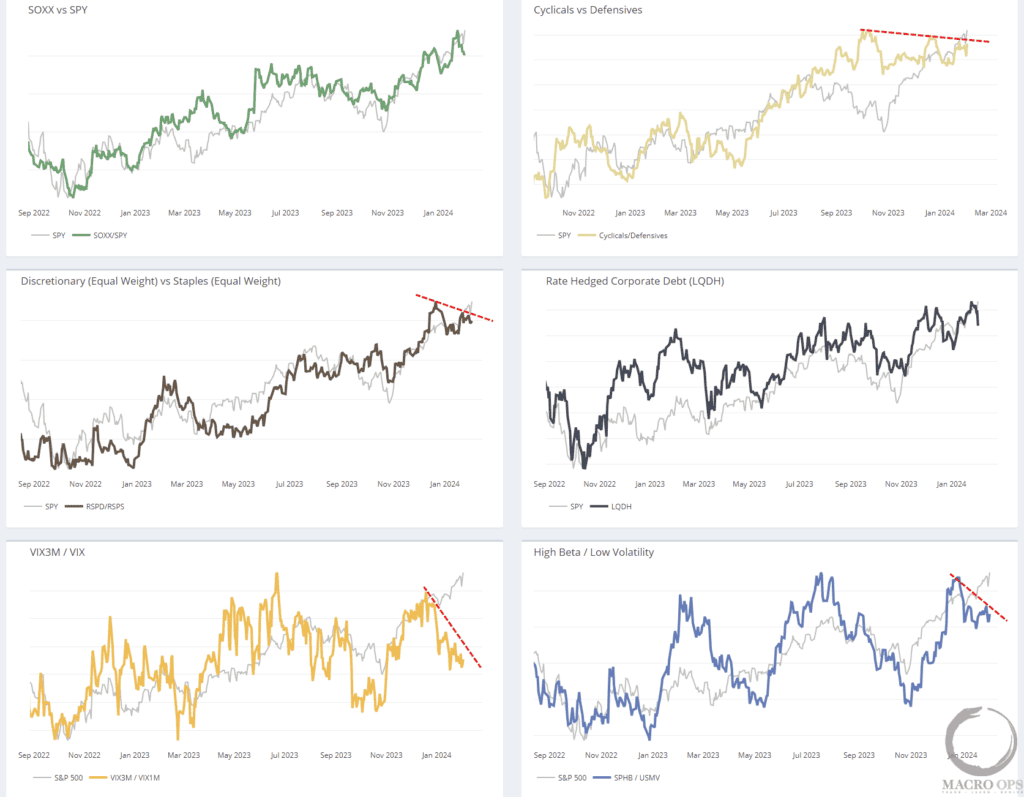
3. One reason we’ve turned a bit more cautious though is that we’re starting to see a growing divergence from our market internals. This is the type of action we see in the lead-up to short-to-intermediate term tops. But it’s important to note that these divergences can go on for weeks before a trend finally ends.
(Click on image to enlarge)
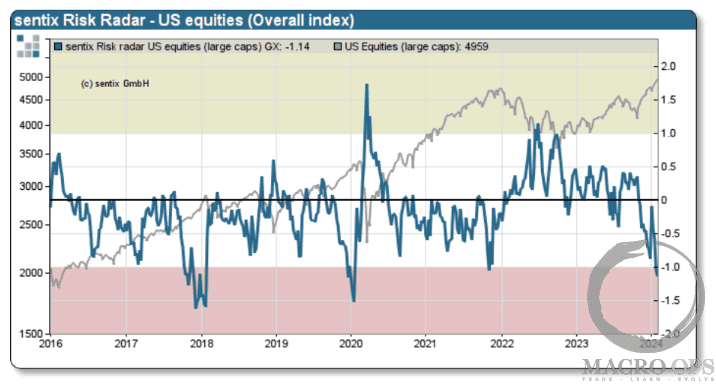
4. Sentix’s “Overall Index”, which tracks technical factors against sentiment and positioning, is also giving its most bearish reading for the US equity market since Nov of 2021.
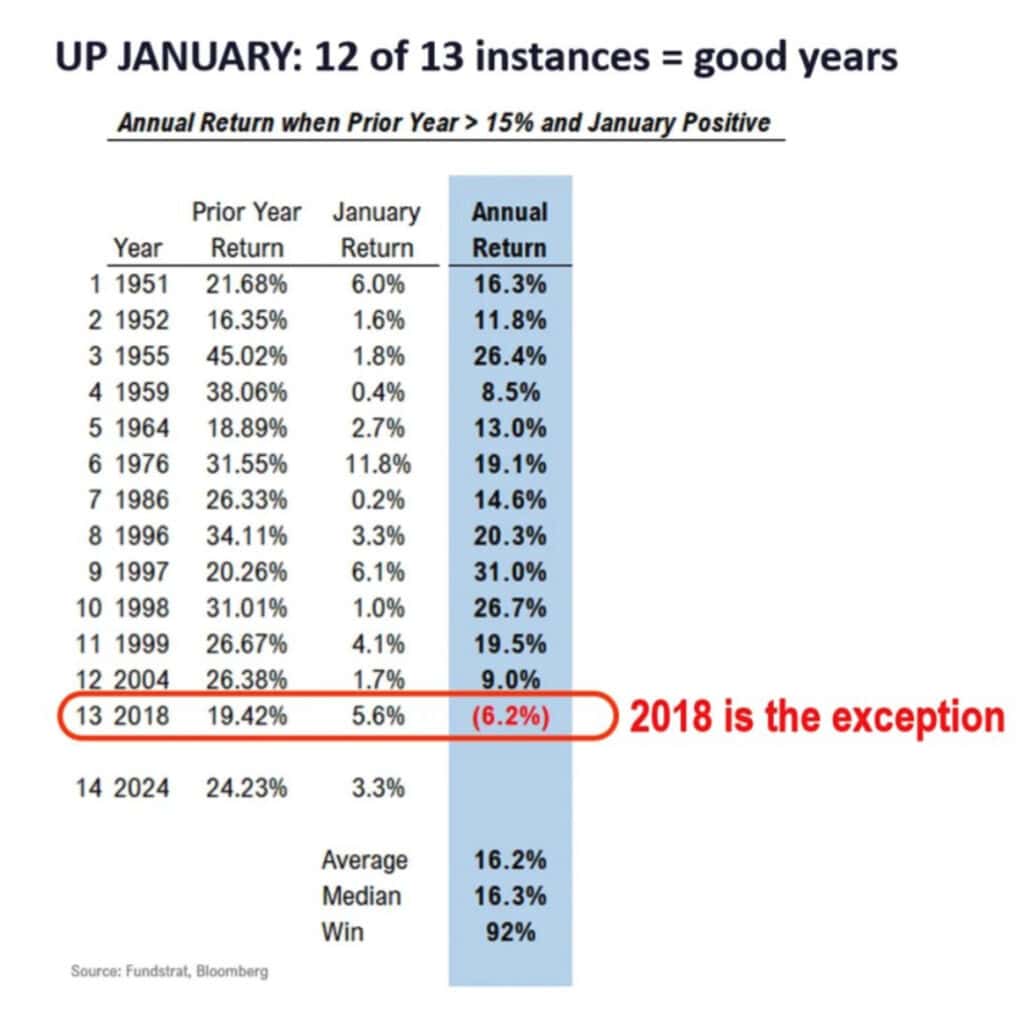
5. From Octavio (Macro Ops Quant): Another January Barometer has turned bullish. When the previous year returned more than 15% and January of the current year is positive, 12 out of the 13 have had positive returns with an average return of 16%. (Source: @fundstrat).
Stay in the trend until it bends, then expect a corrective period to wash out all these weak hands, and lastly look for a resumption of the primary trend, which is headed higher this year.
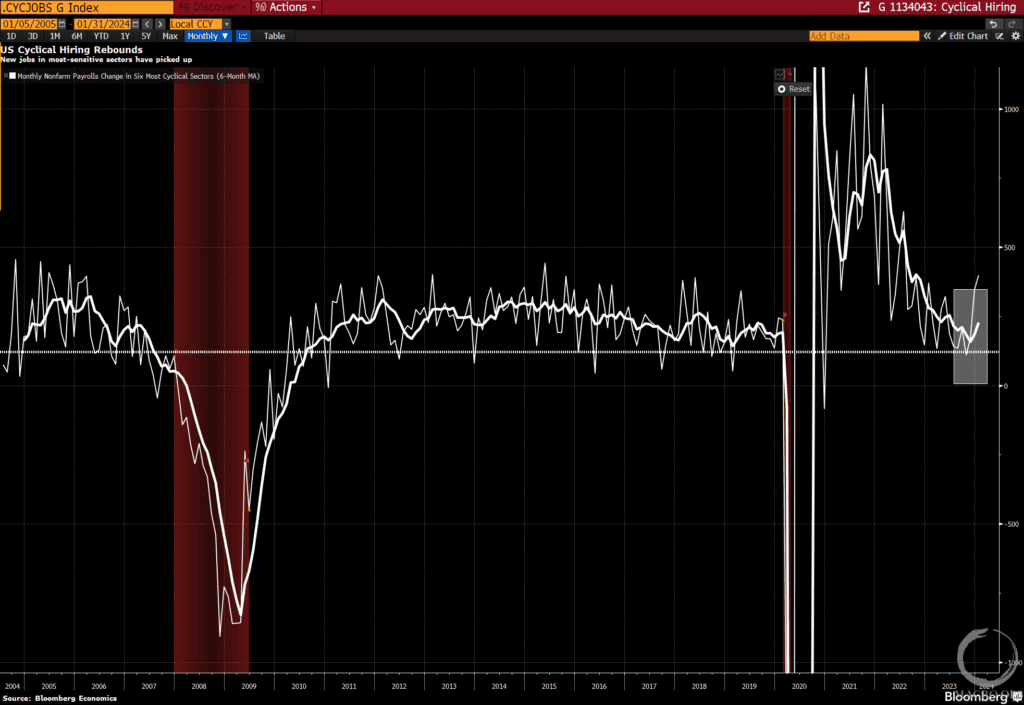
6. This is not what you see when a recession is imminent…. Chart below shows the monthly nonfarm payrolls change in the six most cyclical sectors (chart via BBG).
(Click on image to enlarge)
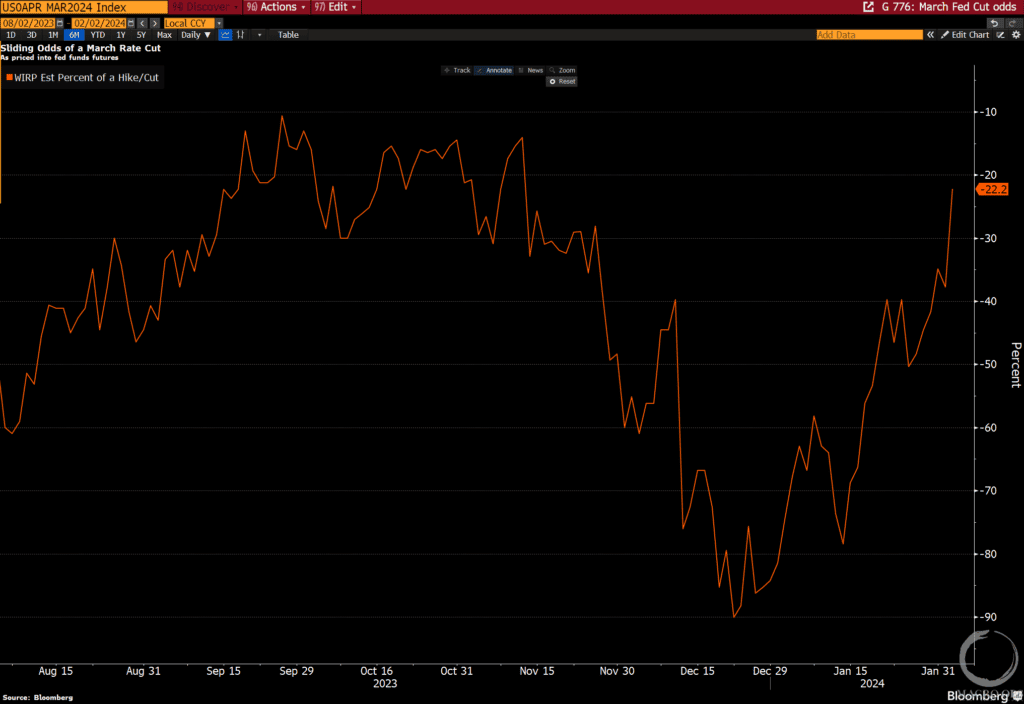
7. Last week’s hot jobs data helped shift the market’s implied probability of a March cut down to just 22%. It went as high as 90% at the end of December.
(Click on image to enlarge)
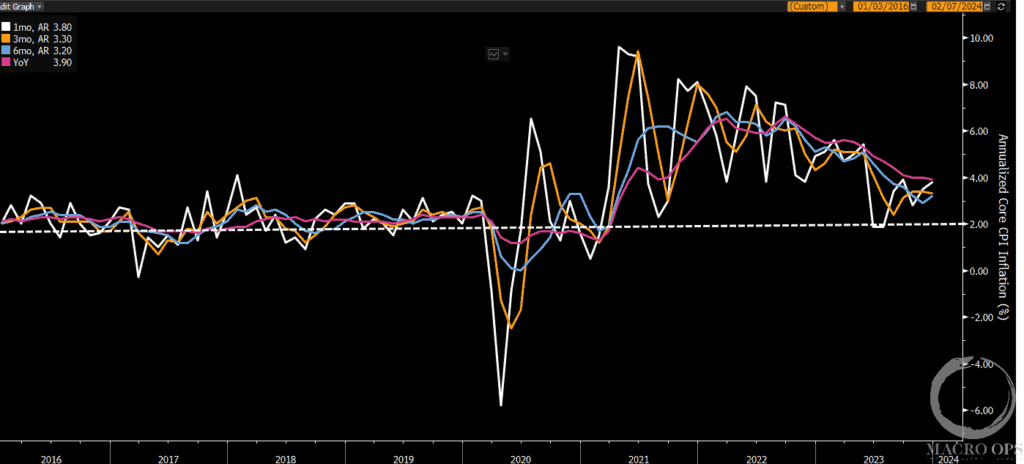
8. We don’t have a strong out-of-consensus view on the short-term path of inflation. But we are closely watching the trends in annualized core CPI where we can see the 1-month change is turning up again (white line).
(Click on image to enlarge)
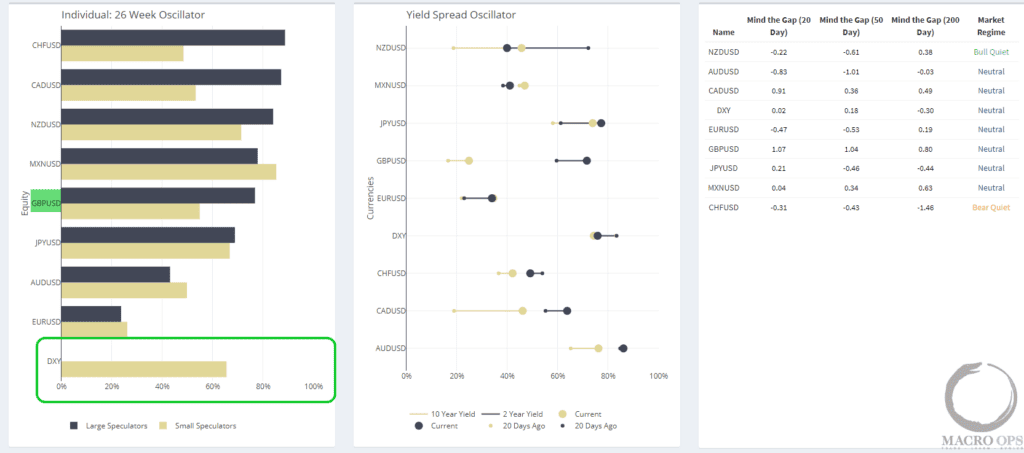
9. The DXY has the most bearish speculative positioning out of all the major pairs at the moment and with expectations around US rates shifting we could see a USD pop soon.
(Click on image to enlarge)
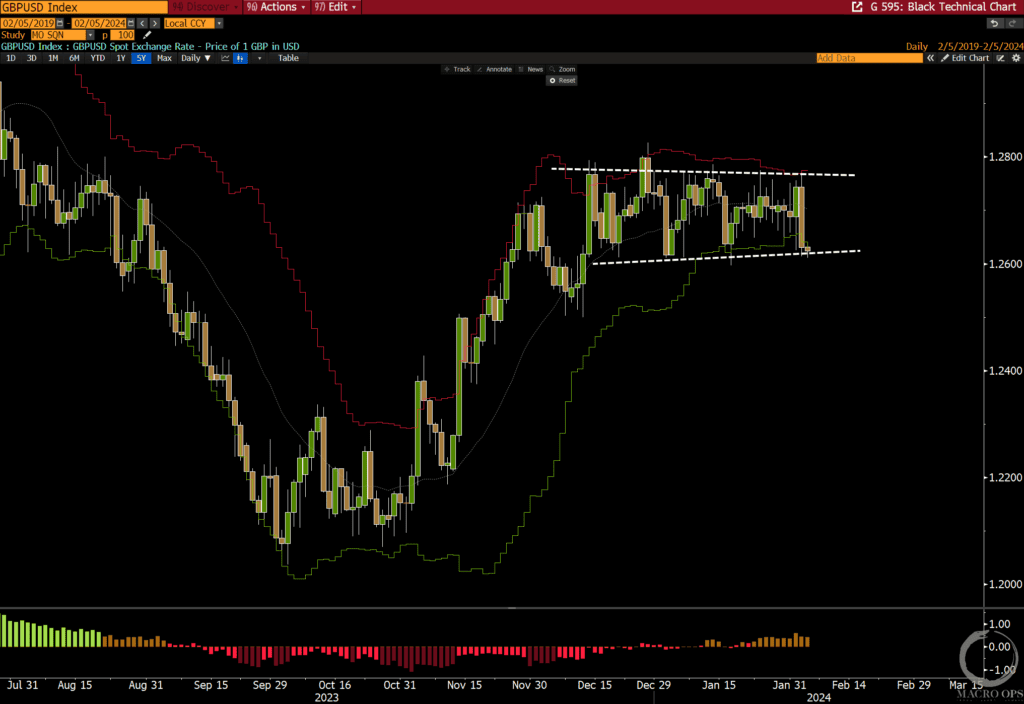
10. GBPUSD could trigger a short on a breakdown from its recent sideways rectangle pattern.
(Click on image to enlarge)
11. From Brandon Beylo (Macro Ops Value):
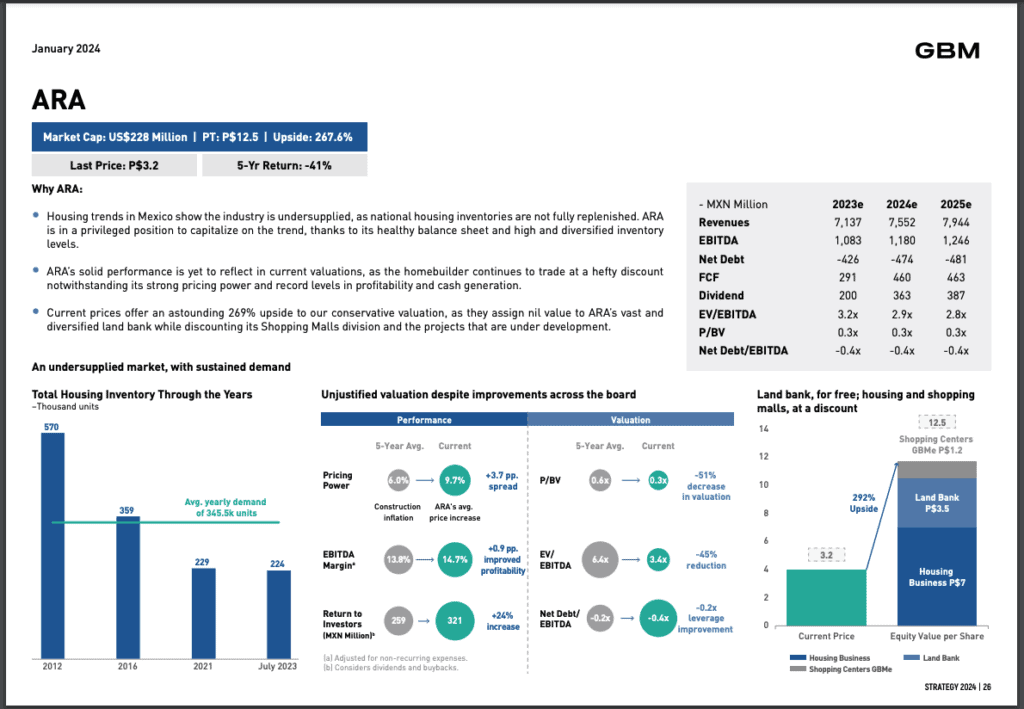
We’re bullish on Mexico over the next 3-5 years, so we’re always looking for new ideas and thematics in that space. GBM recently released its Mexico 2024 Strategy Guide. The PDF includes 15 different investment ideas that are worth researching. If you’re interested in Mexican stocks, this is worth a read.
One idea we like is Consorcio Ara (ARA.BMV). ARA makes affordable housing in Mexico. They trade at 0.3x book value, have consistently bought back stock, and are forming a long-term bullish descending wedge. You can get ARA’s land bank for free and its housing and shopping malls at a discount at the current stock price.
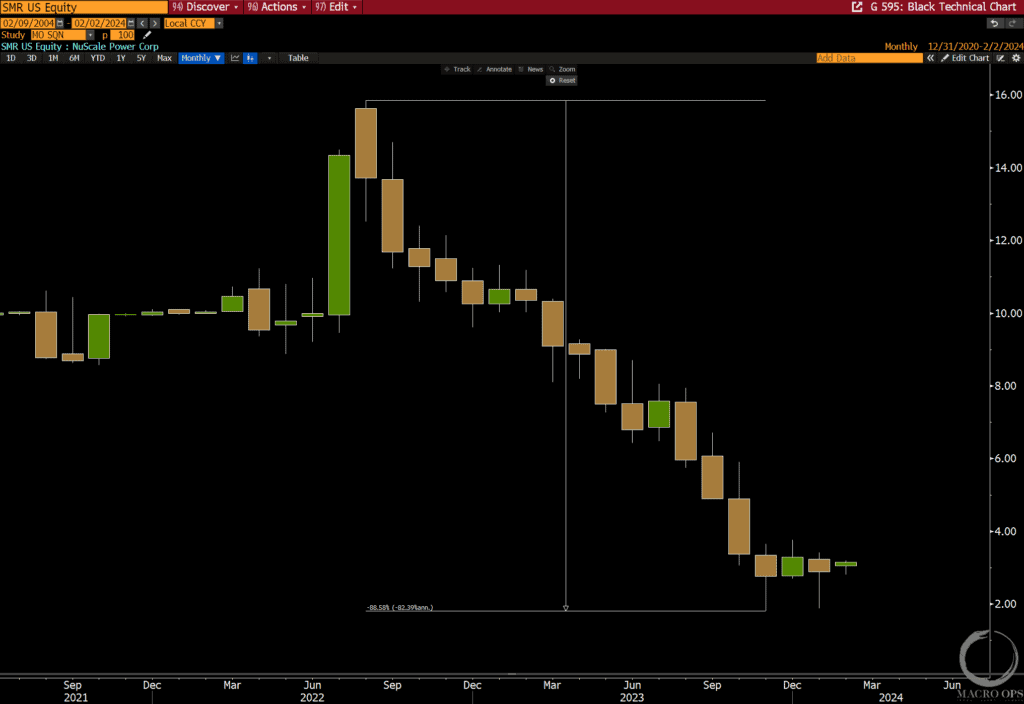
12. NuScale Power Corp (SMR), a maker of small modular nuclear reactors, has traded as much as -88% off its post-SPAC listing but the stock has since put in a double bottom, seemingly finding a firm floor around the $2.75 level (chart below is monthly).
I haven’t looked at this company since its listing but it might be worth a revisit.
More By This Author:
Time To Put On Your Tin Hats
A Bullish Turn Of Year Signal
When In Greece…
Disclaimer: All statements are solely opinions and are for educational purposes only.


It certainly is!