
Bullish view
- Buy the GBP/USD pair and set a take-profit at 1.3727.
- Add a stop-loss at 1.3350.
- Timeline:1-2 days.
Bearish view
- Sell the GBP/USD pair and set a take-profit at 1.3350.
- Add a stop-loss at 1.3727.
The GBP/USD exchange rate held steady on Thursday as the US dollar retreat continued. It jumped to a high of 1.3485, continuing a trend that started when it bottomed at 1.3325.
US Dollar Falls as Government Shuts Down
The GBP/USD pair rose as the US dollar index fell to $97.71 from last week's high of $98.51. This decline also coincided with the drop of the ten-year government bond yield, which reached a low of 4.106%.
The performance is mostly because of the ongoing government shutdown in the United States after disagreementsbetween Democrats and Republicans, who are at a gridlock. It is unclear how long the shutdown will last and its impact on the economy.
(Click on image to enlarge)
The GBP/USD pair also rose after ADP published the latest jobs report, which came out short of expectations. The report revealed that the economy lost over 36,000 jobs in September as employers remained cautious about the economy amid Donald Trump's tariffs.
These numbers mean that the Federal Reserve will likely continue with the interest rate cuts that it started in its September meeting. Data on Polymarket and the CME Fed Watch tool show the consensus is that the bank will cut rates in the next meeting.
On the other hand, the Bank of England is expected to maintain interest rates steady in the coming meetings as the economy goes through stagflation. Stagflation is a period when an economy is slowing while inflation is high.
The most recent data showed that the headline UK Consumer Price Index rose to 3.6% in August, much higher than the bank’s target of 2.0%.
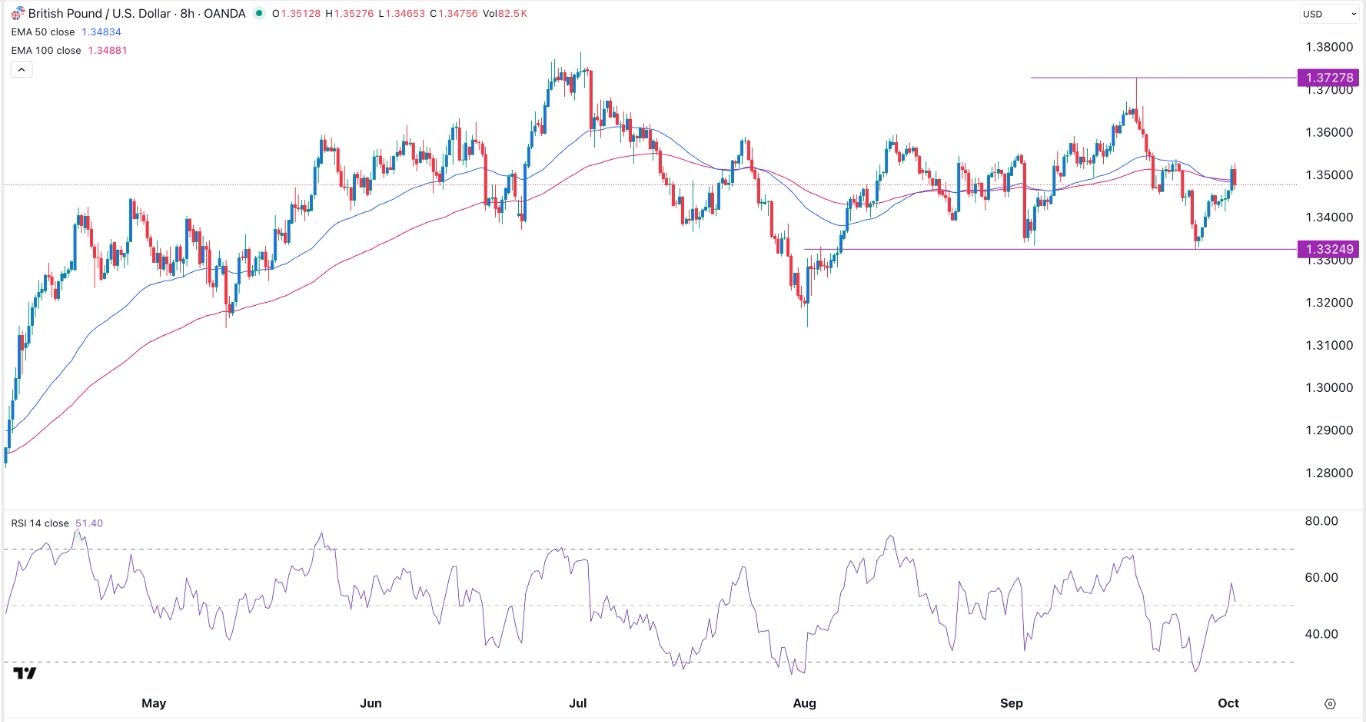
GBP/USD Technical Analysis
The eight-hour timeframe chart shows that the GBP/USD pair has rebounded in the past few days, moving from a low of 1.3325 on September 26 to a high of 1.3480 today.
It formed a double-bottom pattern whose neckline was at 1.3725, its highest level on September 17. A double-bottom is one of the most common bullish reversal patterns in technical analysis.
The pair is now hovering at the 50-period and 100-period Exponential Moving Averages (EMA), while the Relative Strength Index has jumped above 50.
Therefore, the pair will likely continue rising as bulls target the double-bottom's neckline at 1.3727. A move above that resistance will point to more gains to the year-to-date high of 1.3790.
More By This Author:
AUD/USD Forex Signal: Megaphone Pattern Points To More GainsTilray Stock Price Forecast As It Faces Major Headwinds
BTC/USD Forex Signal: Double-Bottom Pattern Forms


Comments
Log in or sign up to join the conversation.